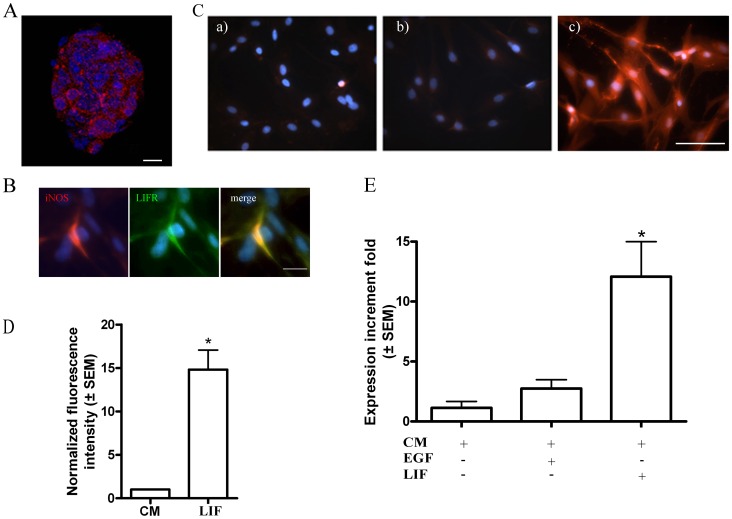
Figure 2. Olfactory neurosphere-derived cells expressed LIF.
A. iNOS immunofluorescence (red) in a neurosphere. Scale bar: 20 µm. B. Co-localization of LIFR (green) and iNOS (red) in cells treated with LIF. DAPI-stained nuclei are blue. Bar: 25 µm. C. Immunofluorescence for iNOS in cells grown in control medium (a), EGF-containing medium (b) and LIF-containing medium (c). Scale bar: 50 µm. D. Flow cytometric analysis showing that LIF increased the iNOS expression measured by the mean intensity of fluorescence of the cells in each group. * p<0.05 respect to the control groups. E. qPCR revealed iNOS mRNA in rat olfactory neurosphere cells grown in control medium (CM), EGF-containing medium and LIF containing medium expressed as the mean ± SEM of the iNOS expression increment fold respect to the control group (CM). *p<0.05 respect to the control groups.

