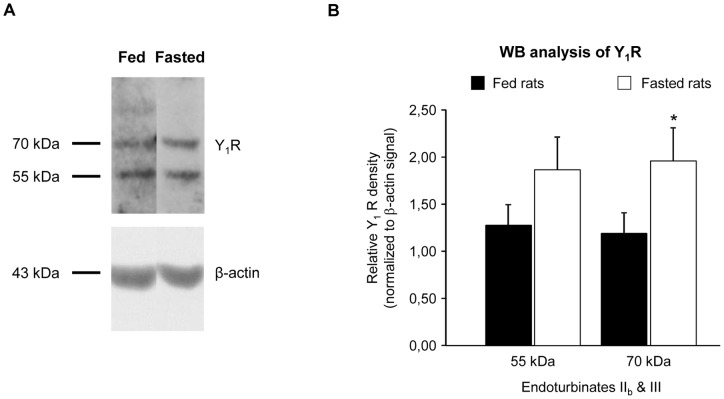
Figure 4. Y1 receptor expression is up-regulated in the OM of fasted rats.
(A) Immunoblotting for Y1R in OM extracts from fed and fasted rats reveals two main bands (55 and 70 kDa) on the western blot membranes. (B) Comparison of Y1R protein expression level in the OM (endoturbinates IIb and III) of fed (n = 5) and fasted (n = 11) rats. The integrated density of each band on the western blots was determined by densitometry using ImageJ software, and normalized to β-actin signal. Each sample was measured on two independent gels. Results from both blots were pooled and are expressed as mean ± SEM; significant difference is denoted by * P<0.05 (Welch's t-test).

