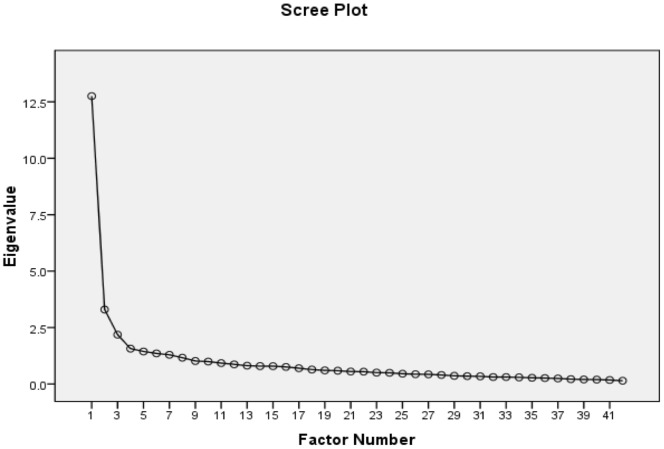
Figure 1. Scree plot for principal axis factor analysis.
Figure 1 shows the scree plot for the principal axis factor analysis of the STS-3. Eigenvalues of the extracted factors are shown on the y-axis, while the ordinal factor number is shown on the x-axis.

