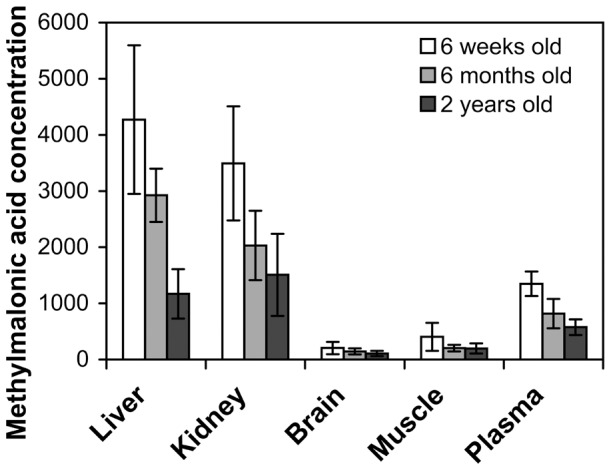
Figure 5. Comparison of tissue and plasma methylmalonic acid levels in the MMA stop codon rescue mice.

Tissue results presented as mean µmol/g tissue ± SEM (n = 8). Control samples had less than 15 µmol/g tissue. Plasma results presented as mean concentration (µmol/L) ± SEM (n = 8), control plasma samples had less than 1 µmol/L methylmalonic acid.
