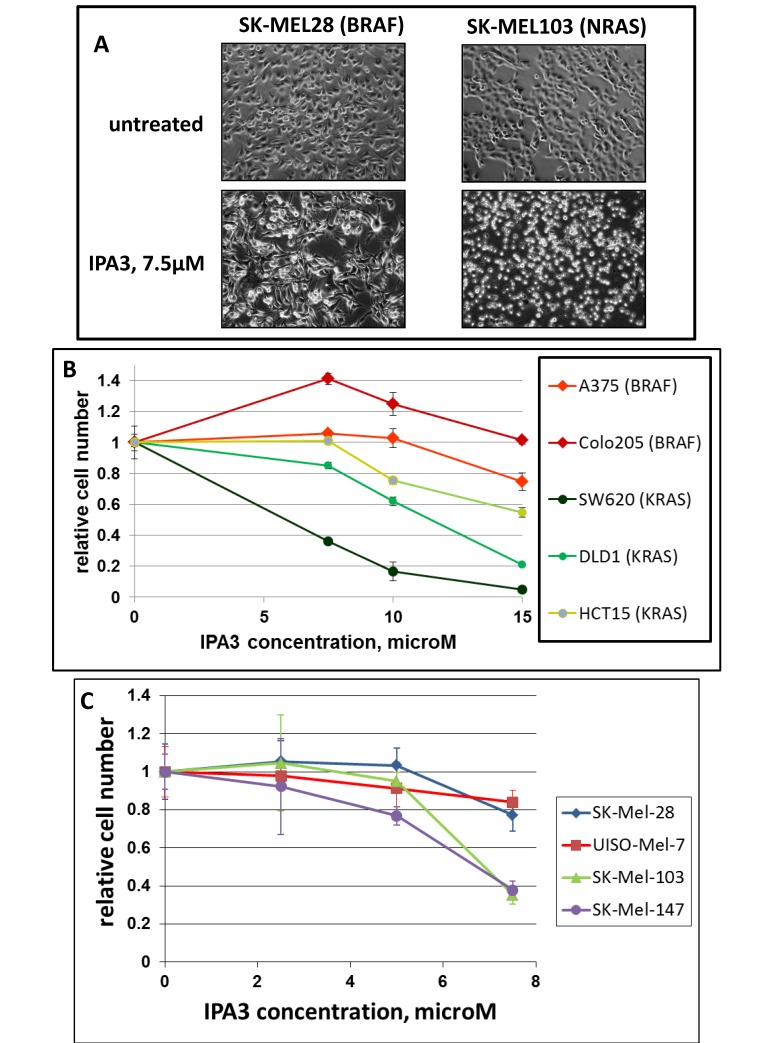
Figure 1. Differential sensitivity of BRAF- and RAS-mutated cells to IPA3.
Indicated cell lines (mutated oncogenes are shown in parentheses) were plated at the same density (30000 cells/well) in 12-well plates and next day treated with various concentrations of IPA3. Two days later, images of the remaining cells were taken (A), and the plates were fixed and the cells were quantified (B and C) by methylene blue staining/extraction method as described in Methods. The number of remaining viable cells is displayed relative to the number of cells in parallel untreated cultures of the same cell line. Each data point was collected in triplicates, and the standard deviations are denoted by error-bars.

