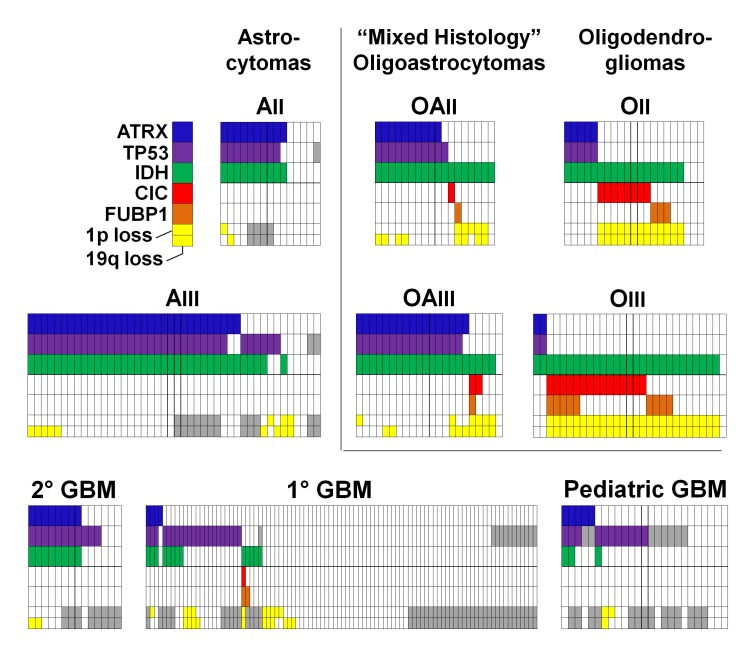
Figure 2. Distribution of ATRX, TP53, IDH, CIC, and FUBP1 mutations, and of chromosomes 1p and 19q loss, in grade II-IV gliomas.
Data are from 15 grade II astrocytomas (AII), 44 grade III astrocytomas (AIII), 21 grade II oligodendrogliomas (OII), 29 grade III oligodendrogliomas (OIII), 18 grade II oligoastrocytomas (OAII), 22 grade III oligoastrocytomas (OAIII), 14 secondary GBMs (2° GBM), 94 primary GBMs (1° GBM), and 25 pediatric GBMs. chromosome 1p status is indicated in the top of the lower row, and chromosome19q status is indicated in the bottom of this cell, with yellow coloring indicating loss of the indicated chromosomal arm. Gray cells denote analyses which were not informative or for which additional genetic material was not available for analysis.

