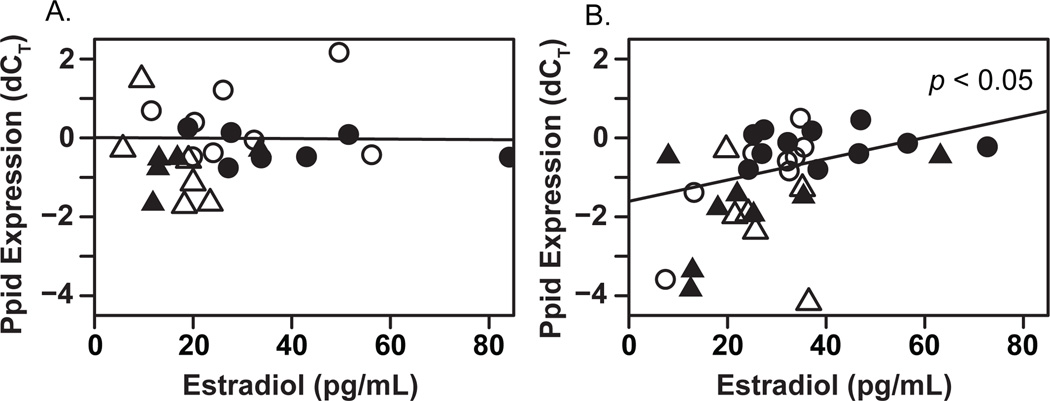
Figure 5.
Regression analysis of Ppid expression and plasma estradiol. Linear regression analysis was performed to determine if the delta CT (dCT) value of Ppid correlated with plasma estradiol. Females without a history of chronic adolescent stress had no correlation of Ppid and plasma estradiol (A). In females with a history of chronic adolescent stress, plasma estradiol predicted expression of Ppid (p < 0.05) (B). Symbols: baseline (open circle), 5 minutes post acute stressor (closed circle), 30 minutes post acute stressor (open triangle), 120 minutes post acute stressor (closed triangle).

