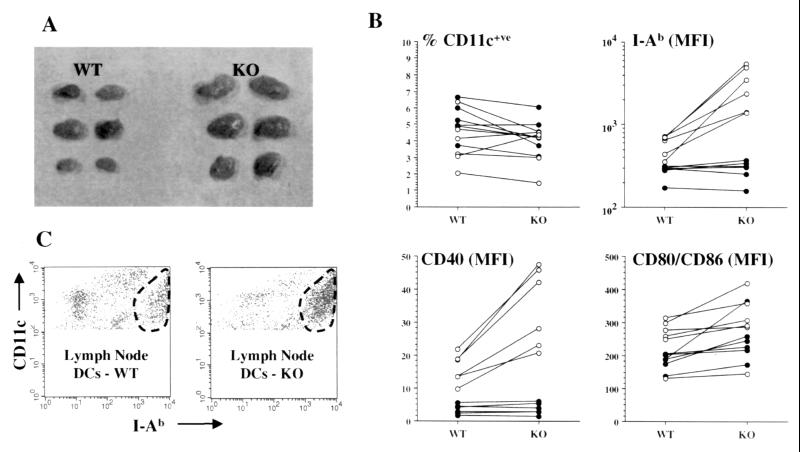
Figure 5.
Analysis of subcutaneous lymph node and splenic DCs from VDR WT and VDR KO mice between 6 and 12 weeks old. (A) Lymph nodes from KO mice were uniformly larger than those of WT (representative example from one pair of animals). (B) Two-color flow cytometric analysis of lymph node (○) and spleen (●) cells from six separately analyzed WT and KO pairs by using stains for CD11c, class II MHC (I-Ab), CD40, and CD80/CD86. Lines connect values for the WT and KO member of each individual pair. P values by paired and nonpaired analysis for differences between WT and KO animals were: lymph node—%CD11c+ve (P = 0.6 and 0.77), I-Ab MFI (P = 0.01 and 0.016), CD40 MFI (P = 0.003 and 0.012), CD80/CD86 MFI (P = 0.03 and 0.33); spleen—%CD11c+ve (P = 0.05 and 0.18), I-Ab MFI (P = 0.4 and 0.7), CD40 MFI (P = 0.3 and 0.8), CD80/CD86 MFI (P = 0.05 and 0.06). (C) An example is shown of flow cytometric analysis of lymph node cells from a VDR WT and KO pair. Class II MHC (I-Ab) expression by CD11c+ve cells is shown. Within the CD11c+ve cells from both animals populations with low, intermediate, and high expression of I-Ab are present. For the KO animal the I-Ab high cells (encircled) represent the predominant population with relative reductions in the I-Ab low and intermediate cells compared with the WT animal.

