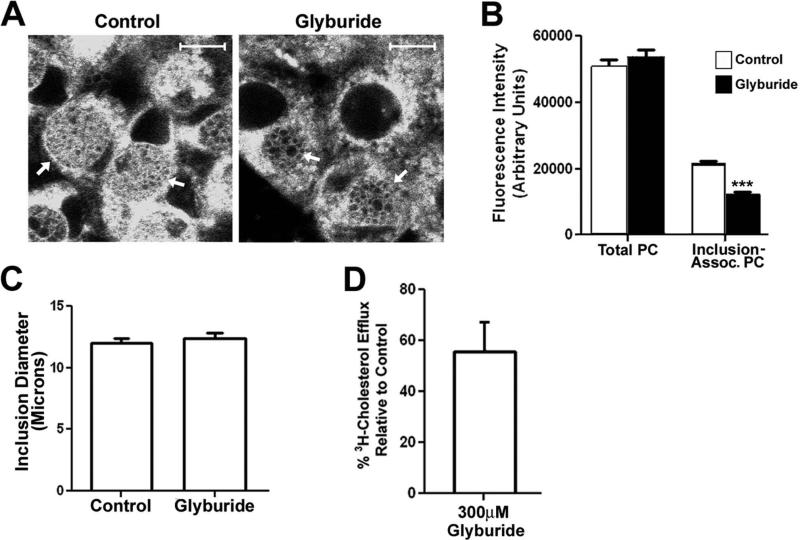
Figure 7.
HeLa cells infected with C. trachomatis serovar D were incubated at 37°C for 28 hours. At this time, the cells were incubated in the absence or presence of 300μM glyburide for 3 hours at 37°C. β-BODIPY FL C5-HPC in fatty acid-free BSA was then added to the media of control and drug-treated cells at a final concentration of 1.5μM and the cells were incubated an additional hour at 37°C. The cells were then fixed in 4% paraformaldehyde in PBS and imaged by confocal microscopy (A). The levels of total and inclusion-associated β-BODIPY FL C5-HPC fluorescence in control and glyburide-treated cells were quantified using the imaging software for the Zeiss LSM 510 confocal microscope as described in the Methods (B). The average diameter of the inclusions in control and glyburide-treated cells was also quantified using the Zeiss imaging software (C). The values shown in the histograms in B and C represent the average values obtained from the analysis of at least 75 cells from two independent experiments. *** p<0.0001 (two-tailed t-test). The effect of 300μM glyburide on the ability of ABCA1 to efflux 3H-cholesterol to extracellular lipid-free apoA-1 (D) was also determined as described in the Materials and Methods. The value shown in D, which is the average of two independent experiments, is expressed as the % 3H-cholesterol efflux to apoA-1 relative to that observed in control cells. Standard deviations are shown in B-D. Arrows in A point to inclusions in control and drug-treated cells. White bars in A are 10μm.

