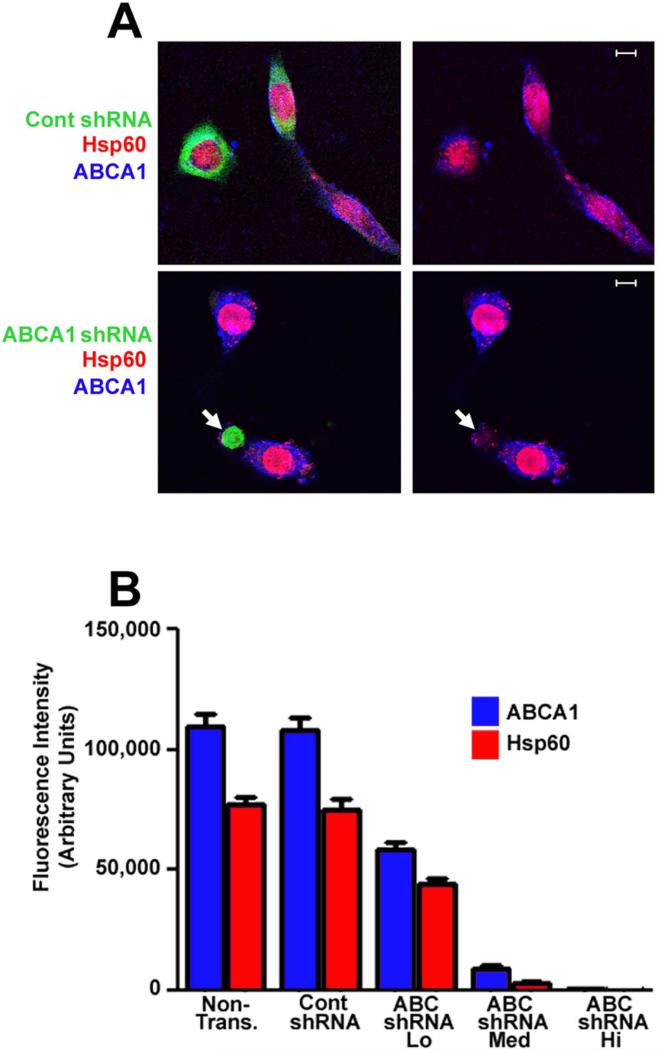
Figure 8.
HeLa cells were transfected with GFP-V-RS plasmids encoding two ABCA1-specific shRNAs or a control shRNA (A). Twenty-four hours post-transfection the cells were infected with C. trachomatis serovar D and the cells were subsequently fixed with 4% paraformaldehyde in PBS at 48 hours PI. The cells were permeabilized and incubated with rabbit ABCA1-specific and mouse Hsp60-specific antibodies. Following washing, the cells were incubated with the appropriate secondary antibodies and imaged by confocal microscopy. The arrows in A indicate a cell expressing high levels of the ABCA1-specific shRNAs. Z-stacks were acquired for each transfected cell and non-transfected control cells and the fluorescence intensity of the GFP reporter encoded by the pGFP-V-RS plasmid was used as a measure of shRNA levels within an individual transfected cell. The cells were arbitrarily grouped into high, medium, and low shRNA expressers based on the detector gain on the confocal microscope required to reach a saturating level of fluorescence for the GFP reporter. In each transfected and non-transfected cell, the fluorescence intensity through the entire Z-stack that resulted from staining with the ABCA1 and Hsp60 antibodies was quantified using the imaging software for the Zeiss LSM 510 confocal microscope. The values shown in the histogram in B represent the average value obtained from Z-stacks of at least 25 different cells. The average Hsp60 fluorescence intensity in cells expressing high levels of ABCA1-specific shRNAs was 225. This value is too small to be seen in the histogram in B. White bars in A are 5μm.

