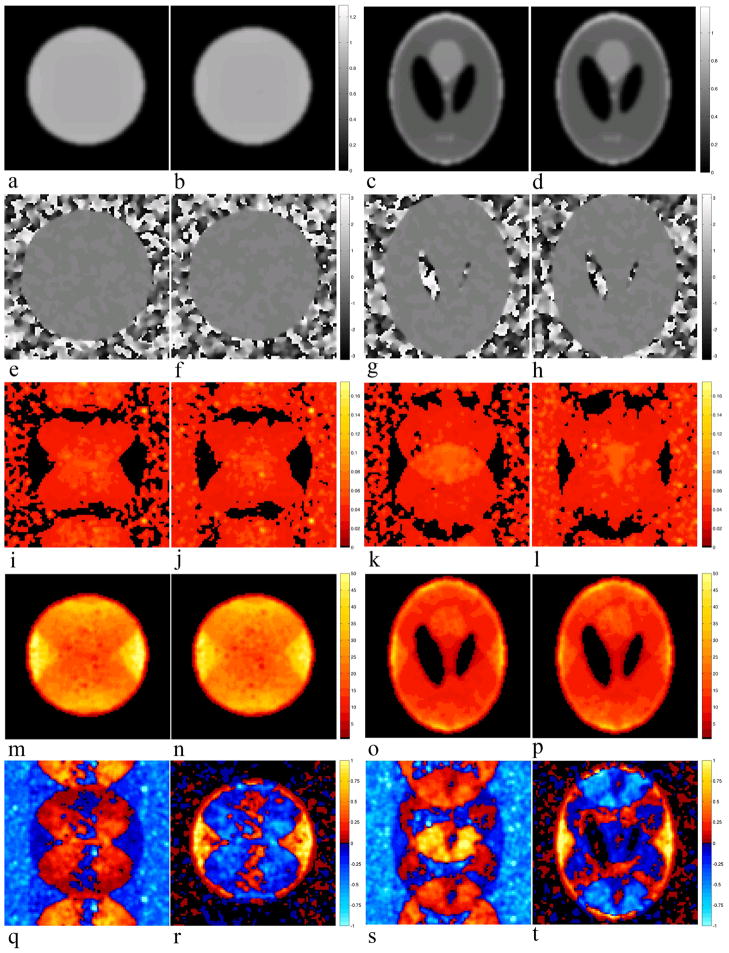
Figure 2.
a)SENSE (SE) circle mean magnitude, b) SENSE-ITIVE (SI) circle mean Magnitude, c)SE Shepp-Logan Phantom (SLP) mean magnitude, d) SI SLP mean Magnitude, e) SE circle mean Phase, f) SI circle mean phase, g) SE SLP mean Phase, h) SI SLP mean phase, i) SE circle standard deviation, j) SI circle standard deviation, k) SE SLP standard deviation, l) SI SLP standard deviation, m) SE circle SNR, and n) SI circle SNR images, o) SE SLP SNR, p) SI SLP SNR images, q) normalized difference SE-SI standard deviation of circle, r) normalized difference SE-SI SNR of circle, s) normalized difference SE-SI standard deviation of SLP, and t) normalized difference SE-SI SNR of SLP. Smoothing (Sm) was applied with a Gaussian kernel with a FWHM of 3 voxels.

