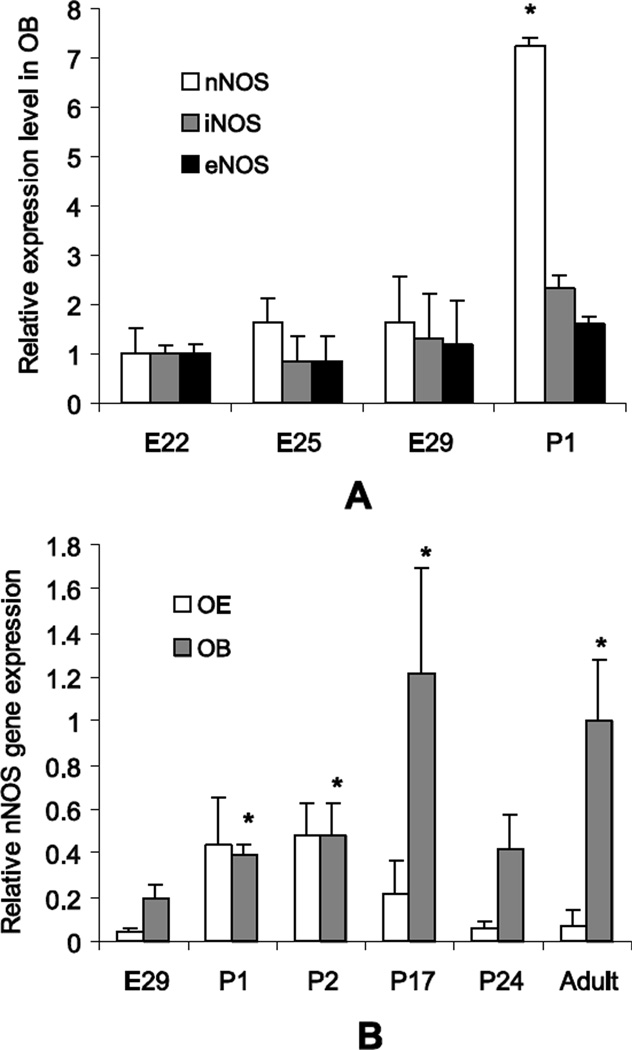
Figure 3.
A. Gene expression of nNOS in OB of normal kits increased rapidly around birth, whereas gene expression of the other NOS isoforms remained the same from E22 to P1. Gene expression levels are normalized to corresponding average levels for each isoform at E22. * - p<0.05 difference from E22, repeated measures ANOVA.
B. Gene expression of nNOS in the OE was relatively high at P1 and decreased with maturation to low levels in adults. Expression of nNOS in OB peaked at P17. Gene expression levels are normalized to the average level of nNOS in adult olfactory bulb. 3–6 samples in each group. *-p<0.05 difference from E29, repeated measures ANOVA.

