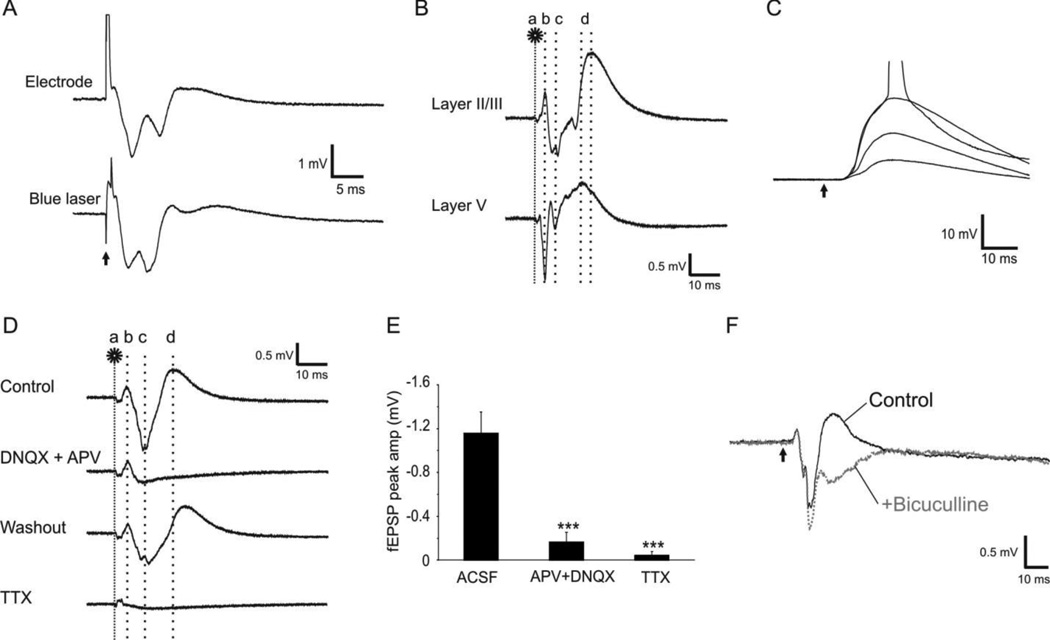
Figure 2.
Field potentials evoked by optogenetic stimulation. A. Extracellular field potentials evoked in cortical layer II/III by electrical (0.2-ms pulse of square current at 0.5 mA, top trace) or optogenetic (2-ms pulse of blue laser at 0.04 mW, bottom trace) stimulation of the white matter. B. The components of optogenetically evoked responses: Following a laser flash on the white matter (a, 1 ms at 0.04 mW), the first negative (layer V) or positive (Layer II/III) peak appeared at 3.3 ms (b), which resulted from direction activation of ChR2 expressing axons. The second peak(s) of fEPSP occurred at ~7.1ms (c), which was followed by a slower large positive peak of fIPSP (d). C. Whole cell current clamp recording was made from a layer II/III pyramidal neuron when laser pulses at increasing intensities (1 ms, 0.01–0.04 mW) were applied to layer V. The constant onset latency of the evoked EPSPs indicates the monosynaptic nature of the responses. The action potential trace is truncated for better demonstration of the EPSPs. D–F. Pharmacology of optogenetically evoked responses. D. Addition of AMPA and NMDA receptor antagonists DNQX (20 µM) and APV (100 µM) blocked fEPSP (b) and fIPSP (c) but not the direct activation (a). This blockade was reversible by washing with normal ACSF. Application of 1 µM TTX abolished almost all components of the evoked response (bottom trace). E. The effects of those drugs on the fEPSP peak amplitudes (−1.16 ± 0.19 mV in control; −0.16 ± 0.09 mV in APV + DNQX, and −0.05 ± 0.03 mV in TTX, ***: P < 0.001). F. Addition of 10 µM GABAA receptor antagonist bicuculline in the ACSF blocked the third outward peak (gray trace), confirming that this component was an IPSP. The arrow indicates the time of laser flash.

