Figure 3.
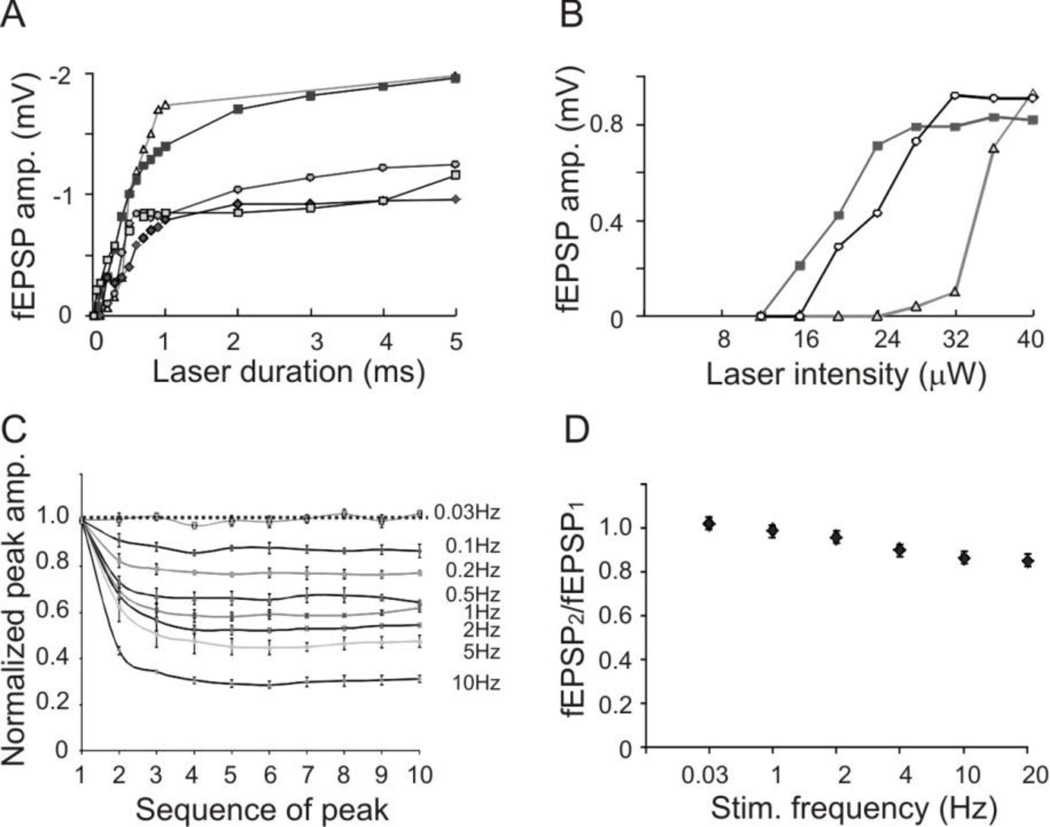
Relationships between parameters of optogenetic stimulation and the evoked responses. A. Relationship between laser duration at maximum intensity (0.04 mW) and peak amplitude of evoked fEPSPs. B. Relationship between laser intensity of 1 ms pulses and peak amplitude of evoked fEPSPs. In both A and B, each line represents recordings from a slice. C. Significant desensitization of ChR2 activation at higher stimulating frequencies: The peak amplitudes of direct activation (peaks b in Fig. 2B) recorded in layer II/III rapidly depressed with increasing stimulating frequency. D. Relationship between fEPSP2/fEPSP1 ratio and stimulating frequency. Optogenetically evoked fEPSPs only slightly depressed at higher stimulating frequencies.

