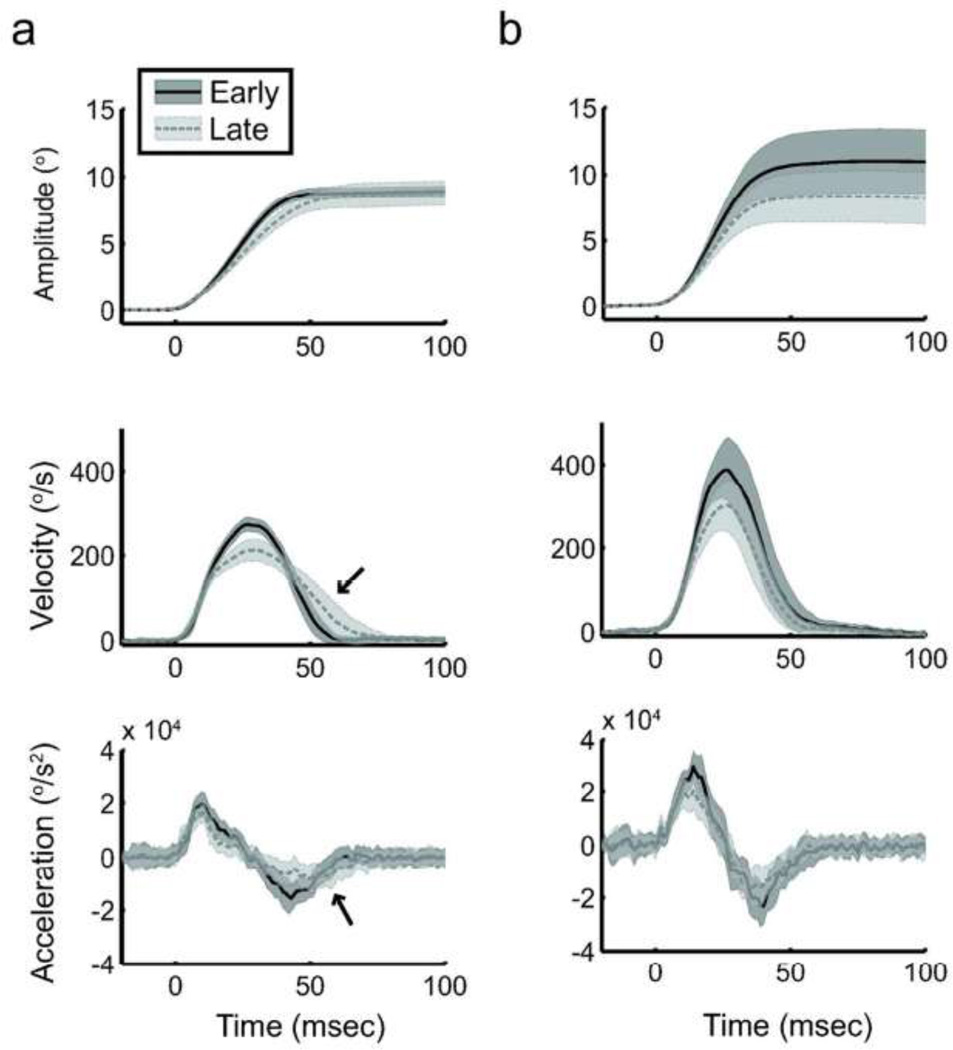
Figure 3.
Saccade kinematics during the long prediction block. Amplitude, velocity and acceleration for 30 consecutive saccades early (solid dark gray) or late (dashed light gray) in the prediction bock. Data are from a representative control subject (a) and SCA6 patient (b) respectively; plotted are means ± SD. The control subject exhibits fatigue in the form of decreased peak velocity, acceleration, and deceleration, but compensates by stretching the deceleration phase (black arrows) such that the saccade remains accurate. In contrast, the SCA6 patient exhibits similar signs of fatigue but cannot compensate for this, and resulting saccades are severely hypometric.

