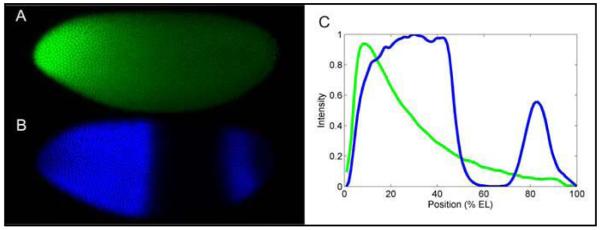
Fig. 1. Hb and Bcd protein profiles (Lopes et al., 2008).
An embryo at mid-nuclear cleavage cycle 14A immunostained for Bcd (A) and Hb (B). (C) Fluorescence intensities for A and B are shown in green and blue, respectively, as a function of position along the AP axis. The diffusion of Bcd protein, translated from its mRNA localized at the anterior end of the egg, forms an exponential concentration gradient. In A and B, the anterior pole is on left and the dorsal side is on top.

