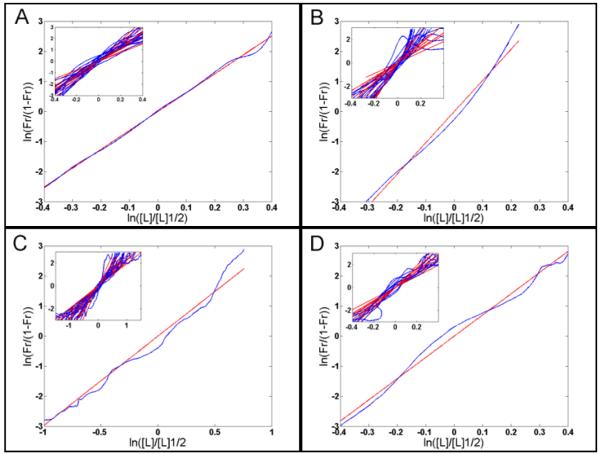
Fig. 2. Estimating the required Hill coefficient to pattern Hb profiles in embryos of different stages or backgrounds (Lopes et al., 2008).
The Hill coefficient is given by the inclination of the straight line (see equation (2) in Material and Methods). (A): Plot from a WT embryo at early cycle 14A exhibiting an nH of 6.3 that is similar to the mean nH (6.3, s.d. 1.4) measured from 15 embryos at this stage (inset). (B): The same plot as in (A) but from a WT embryo at late cycle 14A with an nH of approximately 11.6 that is similar to the mean nH (10.8, s.d. 4.0) measured from 15 embryos at this stage (inset). (C): Same plot as in (A) but from an hb14F embryo at cycle 14A with an nH of approximately 3.0. Inset: 15 embryos at this stage with the mean nH (3.0, s.d. 1.0). (D): The same plot as above from an embryo expressing the pThb5 lacZ artificial construct at cycle 14A and exhibiting an nH of 7.0. Inset: 9 embryos with mean nH (7.0, s.d. 1.5). We assumed early and late cycle 14A embryos corresponded to stages T1-T4 and T5-T6, respectively, according to previous classification (Surkova et al., 2008).

