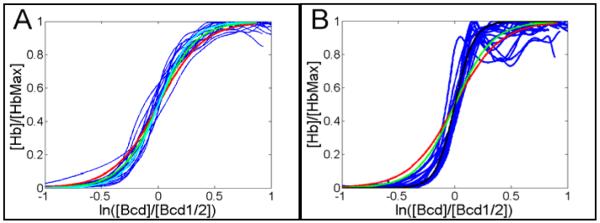
Fig. 3. Estimating the required Hill coefficient to account for Hb sharpness using an alternative plot.
(A) The same data from the 15 WT early embryos used for Fig. 2A but plotted similarly to Fig. 4A by Gregor et al. (Gregor et al., 2007a). (B) The same 15 WT late embryos as in Fig. 2B but plotted as in A. In these graphics, the red, green, cyan and black lines show the plots for an nH of 5, 6, 7 and 10, respectively. It is easy to see that in (A), the nH choice of 6 fits the data better, while in (B), the best choice is 12. This method (see equation (1) in Material and Methods) does not allow a precise determination of nH because visual inspection is used. The straight-line fitting, used for Figs. 2 and 4, is more precise and accurate.

