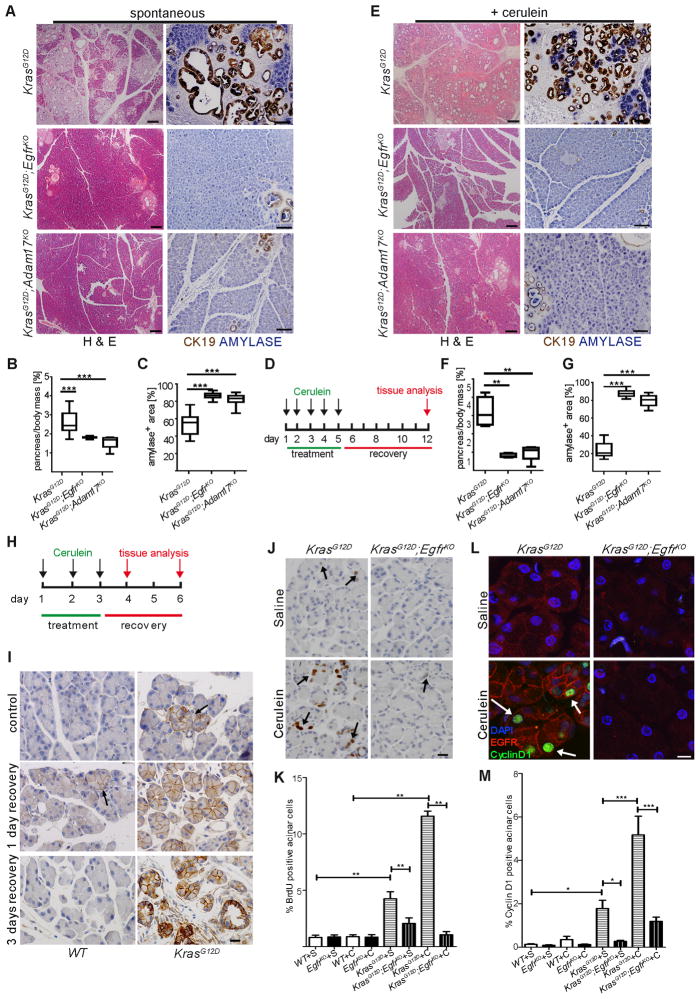
Figure 3. Genetic ablation of EGFR activity prevents KRAS-driven PDA development.
(A–C) Spontaneous and (D–G) cerulein-induced mPanIN formation in KrasG12D;EgfrKO and KrasG12D;Adam17KO mice compared to KrasG12D controls, shown by H&E (left panels, scale bars = 200 μm) and dual IHC for CK19 (brown) and amylase (blue) (right panels, scale bars = 100 μm). Quantitation of pancreas-to-body weight ratios (B&F) and amylase positive area (C&G) (n > 6, ** p < 0.01, *** p < 0.001) compared to control. (H) Truncated cerulein treatment protocol for analysis of premetaplastic signaling. (I) EGFR IHC in saline-treated (control) and cerulein treated WT (left panels) and KrasG12D (right panels) pancreata with 1 day and 3 days recovery. Arrows indicate focal areas of high EGFR expression. n = 3, scale bars = 20 μm. (J) BrdU incorporation measured by IHC in acinar cells of saline or cerulein-treated KrasG12D and KrasG12D;EgfrKO pancreata with 3 days recovery. Arrows indicate positive acinar nuclei. Scale bar = 20 μm (K) Counts of BrdU+ acinar cells, n=3, **p<0.01. (L) Co-IF for CyclinD1 (green) and EGFR (red) in saline or cerulein-treated KrasG12D and KrasG12D;EgfrKO. Arrows indicate some positive acinar nuclei. Scale bar = 10 μm (M) Quantitation of CyclinD1 expression (*p<0.05,***p<0.001, all other differences were not significant. n=3). Error bars in all panels are +/− SEM. See also Figure S3.

