Figure 3 .
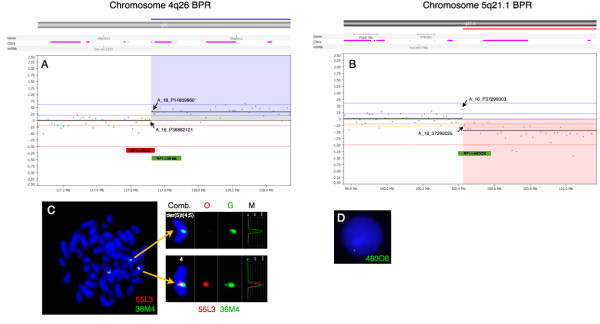
High-resolution array CGH reveals the breakpoints of the unbalanced translocation.
Vertical blue lines indicate log2 ratios +0.24, +0.60 and 2.50 and red lines indicate log2 ratios −0.24, -1.00 and −2.50. At the top are indicated location of genes, CNV’s and miRNA. The X-axes at the bottom indicate chromosomal position. A. The break point at 4q26 was between the oligo-ID’s A_16_P36882121 (pos. 117,710,502) and A_18_P14859960 (pos. 117,727,528) (arrows). Blue shade indicates part of gained region. Location and size of the BAC probes RP11-55 L3 (red bar) and RP11-36 M4 (green bar) are indicated. B. The break point at 5q21.1 was between the oligo-ID’s A_16_P37295003 (pos. 100,418,842) and A_16_P37295025 (pos. 100,432,041). Red shade indicates part of lost region. Location and size of the BAC probe RP11-460O8 (green bar) is indicated. C. Left panel. Metaphase FISH using BAC probes RP11-55 L3 (red) and RP11-36 M4 (green) showing two fused signals (normal chromosome 4) and one green signal on der(5)t(4;5). Right panel. Single color gallery tool showing individual color schemes, orange (O) and green (G), and intensity measurements of each color channel (M). As can be seen in the der(5)t(4;5) panel there is a weak red signal and a strong green signal showing that the break point is within RP11-55 L3. D. FISH using RP11-460O8 (green) showing a nucleus with 1G1g pattern indicating that there is partial mono-allelic loss of the probe representing the break point.

