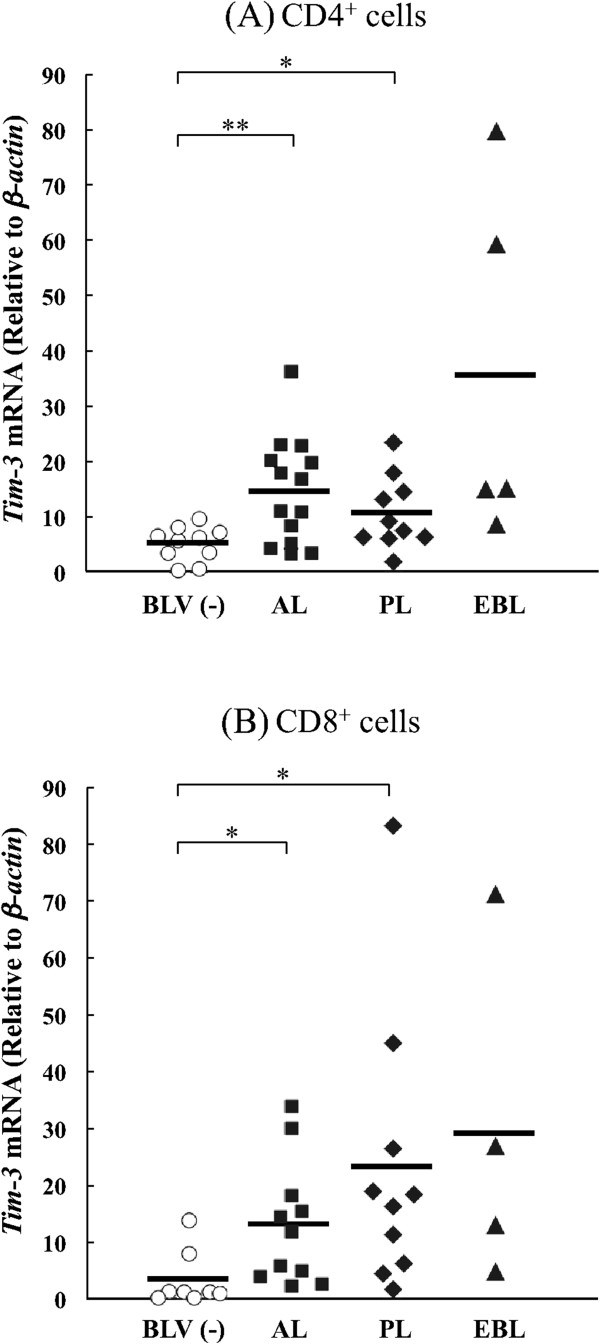
Figure 4.
Quantitative analysis of bovine Tim-3 expression in BLV-infected cattle at different disease stages. CD4+(A) and CD8+(B) cells from BLV-negative and BLV-infected cattle with AL, PL and lymphoma (EBL) were analyzed. Individual dots indicate Tim-3 expression level in the cells from BLV-uninfected (empty circle), AL (full square), PL (full quarry) and lymphoma (full triangle). Each line indicates the mean percentages in each group. Differences between groups were considered statistically significant at probability values of p < 0.05 (* p < 0.05; ** p < 0.01).

