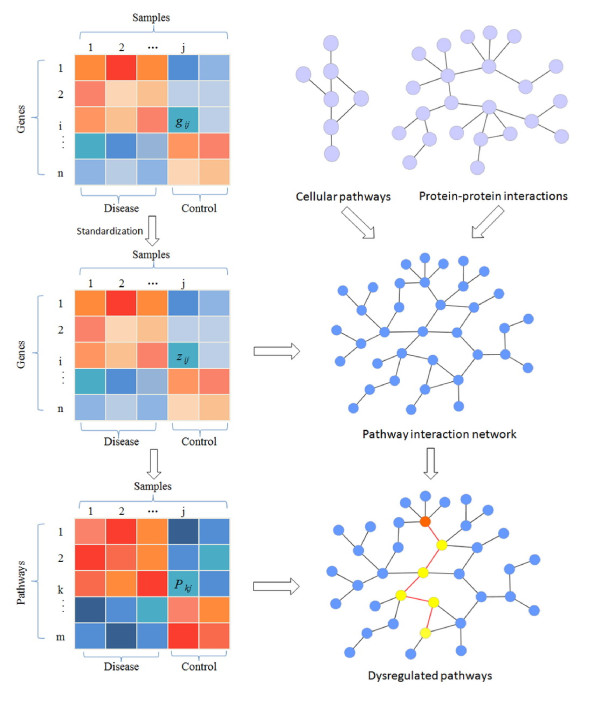
Figure 1.
Schematic illustration of identifying dysregulated pathway in cancer. Firstly, gene expression profiles were standardized. Secondly, the genes were mapped to pathways. For each pathway, the principal component analysis (PCA) was employed to calculate the pathway activity score that summarizes the expression values of genes in each pathway. Thirdly, the pathway interaction network (PIN) was constructed based on gene expression data, protein-protein interactions, and cellular pathways. In the PIN, each node represents a pathway while each edge denotes the functional association between two pathways. Fourthly, the dysregulated pathways were identified as pathway markers that can best distinguish diseases from controls. The red node in PIN is the firstly identified pathway marker in disease, and the yellow ones are those pathway markers that can be combined with the first selected pathway to obtain best classification results while discriminating between diseases and controls.

