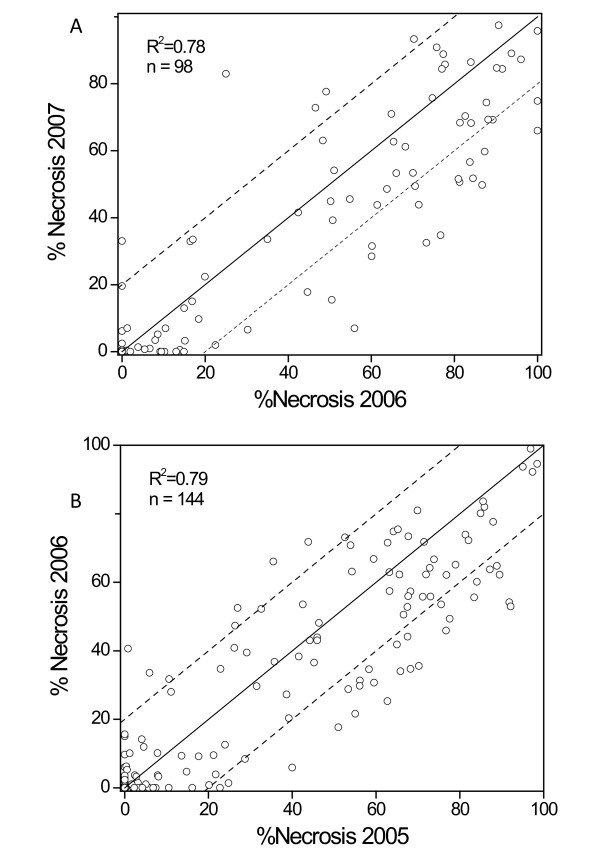
Figure 1 .
Scatter plots of fire blight severity. Scatter plot of percentage of the current season’s shoot length that became necrotic following inoculation with E. amylovora (% SLN) evaluated in A) 2006 and 2007 on 83 progeny of ‘Malling 9’ x ‘Robusta 5’-NZ, and B) 2005 and 2006 on 132 progeny of ‘Idared’ x ‘Robusta 5’-DE. The R2 value is for the linear line of best fit, and not for the 1:1 line as shown in the figure. Dashed lines indicate boundary for more than 20% difference between years.

