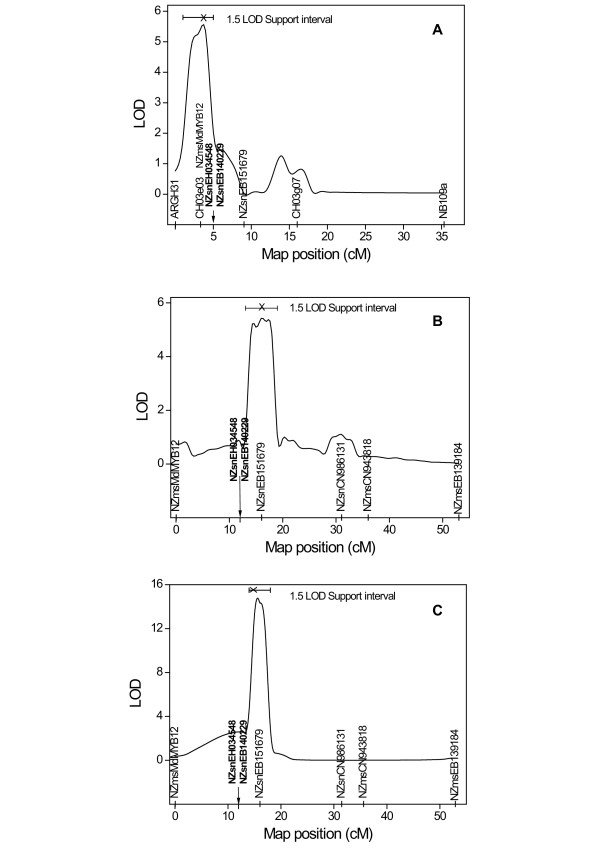
Figure 3 .
QTLs on Linkage Group (LG) 3 of ‘Robusta 5’ for fire blight resistance identified in the ‘Malling 9’ x ‘Robusta 5’ New Zealand (M9xR5-NZ) and ‘Idared’ x ‘Robusta 5’ Germany (IxR5-DE) populations. A)* LOD score curves for Single QTL Composite interval mapping (CIM) in M9xR5-NZ following inoculation with Erwinia amylovora strain ICMP11176. B) LOD score curves for CIM in IxR5-DE following inoculation with E. amylovora strain ICMP11176 by the Multiple Imputation method using 128 imputed datasets and 1000 permutations to estimate LOD thresholds. C)* LOD score curves for CIM in IxR5-DE following inoculation with E. amylovora strain Ea222_JKI. * In A and C markers outside a window length of 3 cM were used as co-factors; interval mapping method used was ‘Hayley-Knott’ regression; the 95% confidence limits estimated by 1.5-LOD drop-off method are shown at the top figure; and putative fire blight resistance genes NZsnEH034548 and NZsnEB140229 mapped to the same position (indicated by arrow) and were excluded from the analyses. The LOD thresholds at significance levels of 5% and 1% calculated from 1000 permutations were [1.8, 2.5], [1.6, 2.6] and [1.7, 2.3], respectively, for Figures 3A, 3B and 3C. Two alternative CIM methods (EM algorithm and Imputation) produced similar results.

