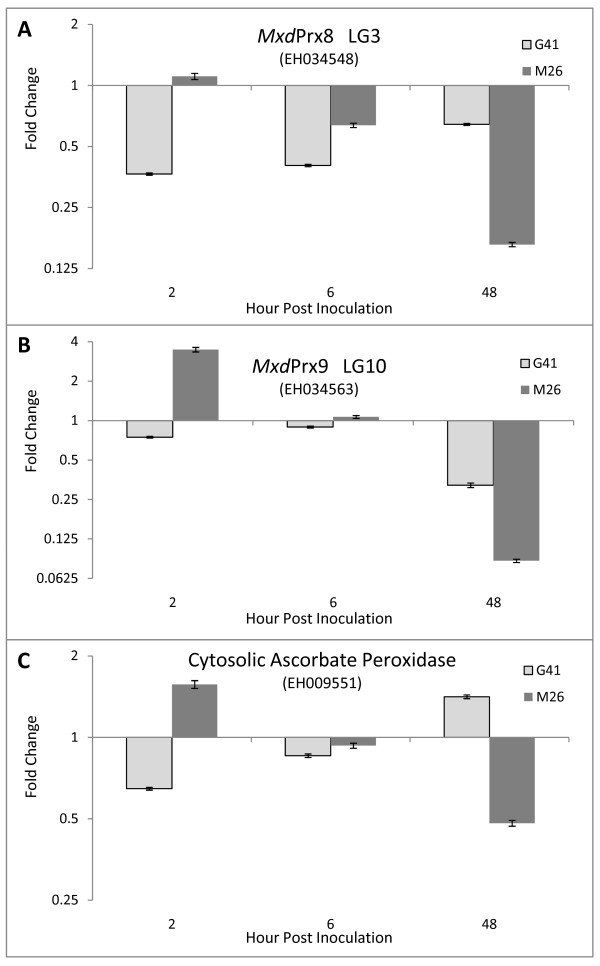
Figure 5 .
Relative transcript abundance of three peroxidase genes in ‘Geneva 41’ and ‘Malling 26’ apple rootstocks. Fold change in transcript abundance of three peroxidase genes in fire blight resistant ‘Geneva 41’ (light gray) and susceptible ‘Malling 26’ (dark gray) Malus rootstocks following inoculation with Erwinia amylovora. A: MxdPrx8, a class 3 peroxidase that co-located with a QTL for fire blight resistance on LG3 of ‘Robusta 5’-NZ; B: MxdPrx9, a class 3 peroxidase that mapped to Linkage Group 10; and C: a class 1 cytosolic ascorbate peroxidise. Transcript abundance was determined by RT-qPCR, is expressed as fold change in comparison to mock challenged tissue of the same genotype sampled at the same hpi and is represented on a log2 scale to equalize magnitude of induced and repressed gene expression; a fold change of 1 indicate no difference from mock-inoculated (reference) whereas values less than 1 indicate repression of gene expression. Transcript abundance was normalized to an elongation factor 1 internal control and fold change calculated by the 2-ΔΔCt method; error bars are the ΔΔCt standard deviation calculated from the technical replicates [3] of all 3 biological replicates (total of 9) [103]. EST sequence used for PCR primer design is indicated in brackets (GenBank accession number).

