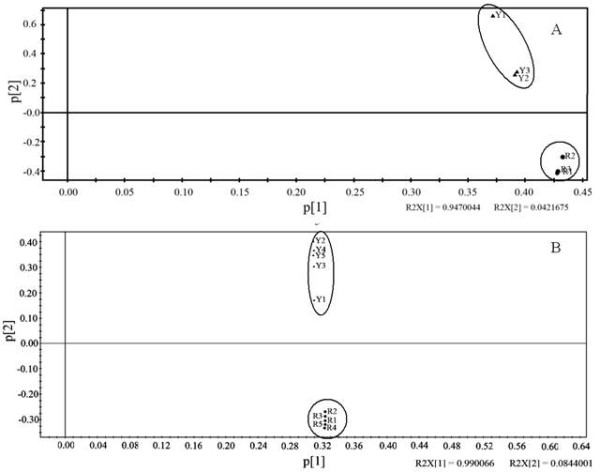
Figure 2.

Metabolic profile differences between flower buds of FLJ and rFLJ as detected based on PCA of GC-MS and HPLC data. (A) PCA of metabolic profiles based on GC-MS analysis (n = 3). (B) PCA of metabolic profiles based on HPLC analysis (n = 5). Y1–Y5, FLJ samples; R1-R5, rFLJ samples. Distinct metabolic profiles that correspond to a particular species are circled in (A) and (B). PCA analyses were performed by using the SIMCA-P + (12.0.0.0.0) program (Umetrics AB, Tvistevdgen 48 Umea 907 19, Sweden). p [1] is the first principal component, and p [2] the second principal component.
