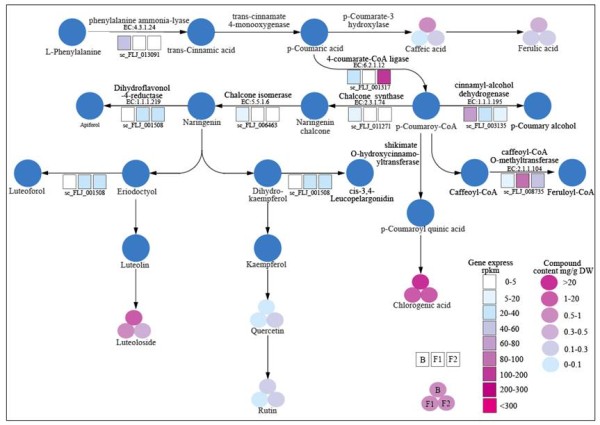
Figure 4.

Pathway of active compound biosynthesis in the flowering samples of FLJ. Circles represent compounds and six different colors indicate the content of active compounds ranging from 0 to above 20 mg/g DW. Squares represent gene express level and the nine different colors indicate RPKM values of the ESTs. Three-fold circles and three-row squares display the content of compounds and gene express levels. Abbreviations: B, bud; F1, flower1; and F2, flower2.
