
Figure 5.
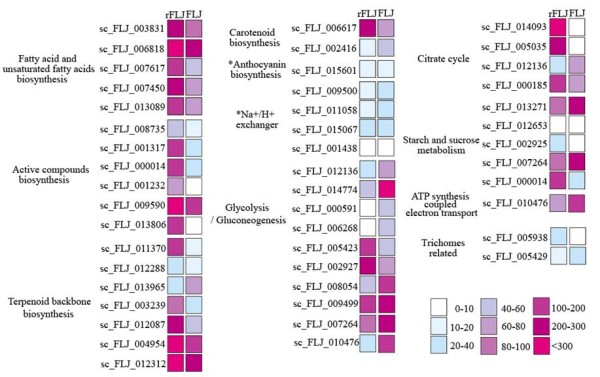
Gene transcription level in flower buds of FLJ and rFLJ. The square represents gene express levels, and the nine colors indicate the RPKM values of the ESTs as calculated according to the grape full-length cDNA sequences. * denotes no differential expression between FLJ and rFLJ.