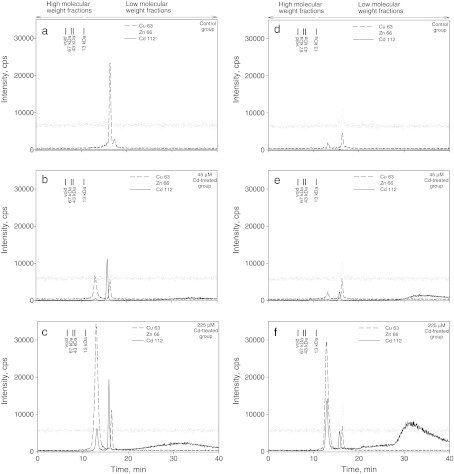
Fig. 2.
a-f SEC-ICP-MS electropherogram of 112Cd+, 66Zn+, and 64Cu+ intensity in A. halleri extracts from roots [control plants (a), plants treated with 45 μM Cd (b), plants treated with 225 μM Cd (c)], and shoots [control plants (d), plants treated with 45 μM Cd (e), plants treated with 225 μM Cd (f)]. The signal from 112Cd+ is designated by the solid line; the signal from 66Zn+ is designated by the dashed line, and the signal from 64Cu+ is designated by the dotted line

