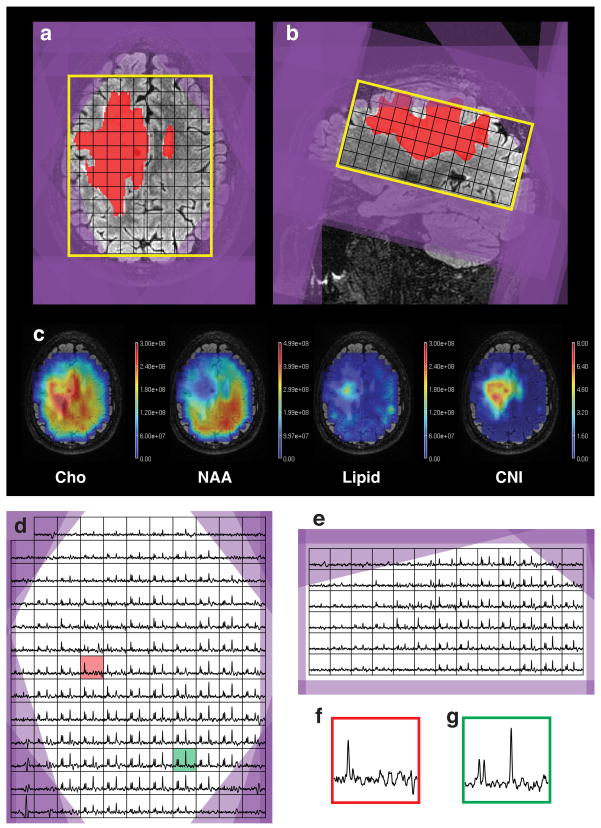
Fig. 5.
(a, b) Automatically generated MRSI prescription (yellow -PRESS box, purple -saturation bands), overlaid on top of T2 FLAIR images and T2 lesion mask (red); (c) metabolite maps; (d, e) axial and sagittal slices through the spectral grid; (f, g) sample spectral voxels from T2 lesion (red, location shown on Fig. 6d) and healthy tissue (green).

