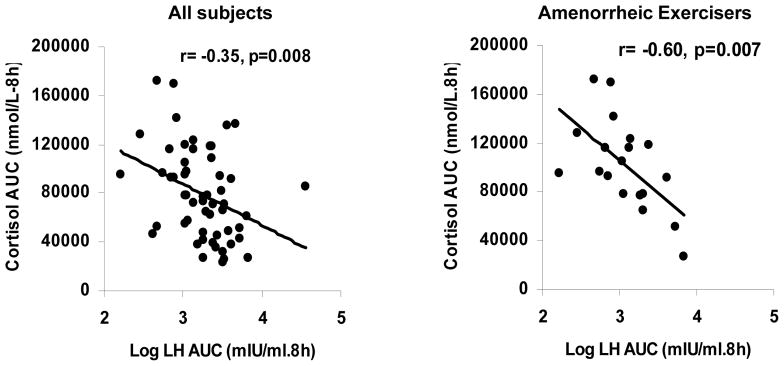
Figure 2.
Associations between cortisol area under the curve (AUC) with LH AUC for the group as a whole and within amenorrhoeic exercisers. The figure shows the inverse association of cortisol AUC with LH AUC for all subjects (left) and amenorrhoeic exercisers (right). Correlation coefficients and p values are indicated in the figure

