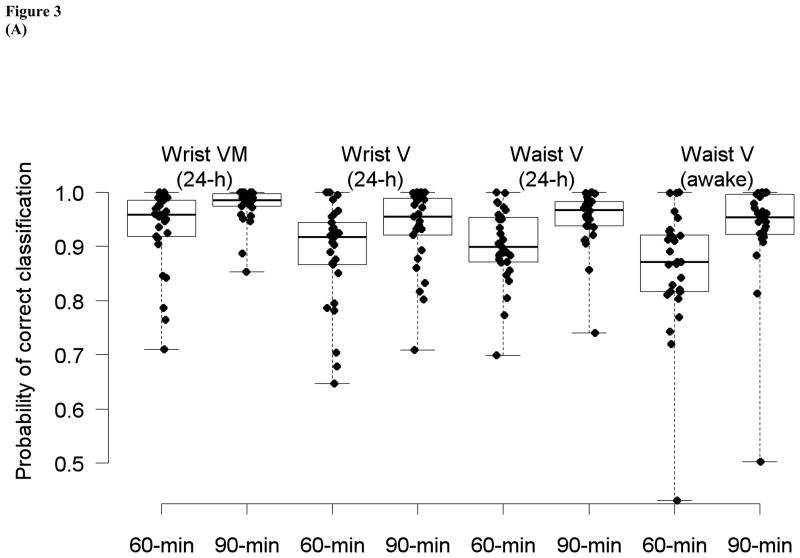
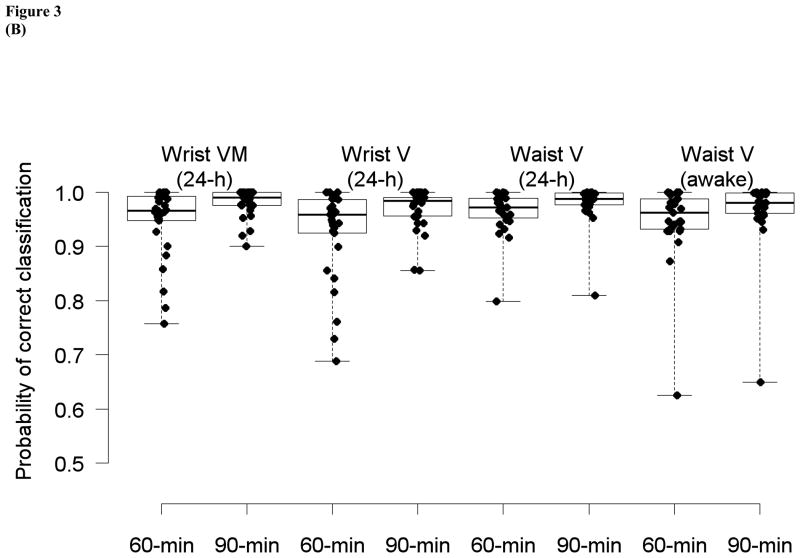
Figure 3.
Box plots of individual probability of correct classification by algorithms with two window time settings (60- and 90-min) using wrist (VM and V) and waist (V) counts data during 24-h and both monitors-worn waking periods: (A) Alg[Troiano]; (B) Alg[Choi]. The solid circles represent individual data points (N=29).


