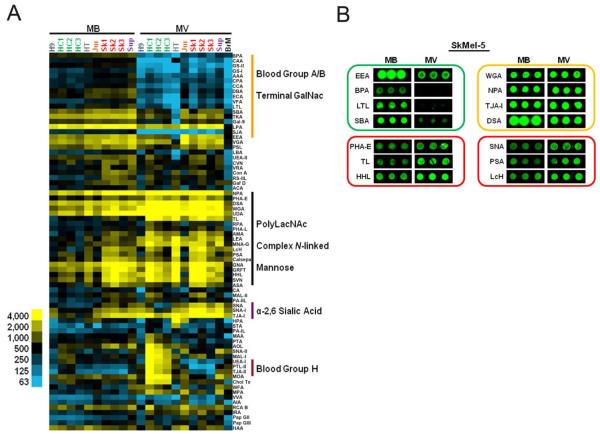
Figure 2.
SkMel-5 microvesicles and cell-membranes have discrete glycomic profiles. (A) Equal amounts (1.5 μg by protein) of Cy3-labeled samples were added to the lectin microarray. Lectins were hierarchically clustered by using the Pearson correlation coefficient as the distance metric and average linkage analysis (n = 74 lectins). The tree is not shown. The arrays are manually organized. Heat map of the background corrected median fluorescence (average of three spots) is shown. Yellow indicates median fluorescence units > 500 and blue indicates median fluorescence < 500. Abbreviations: GalNAc (N-acetylgalactosamine), PolyLacNAc (poly-N-acetyllactosamine) (B) Comparison of SkMel-5 MV and MB demonstrates exclusion (green block) and enrichment (red blocks) of glycan epitopes in MV as well as lectins that bind equally to both (yellow block) as determined by the average median fluorescence signal.

