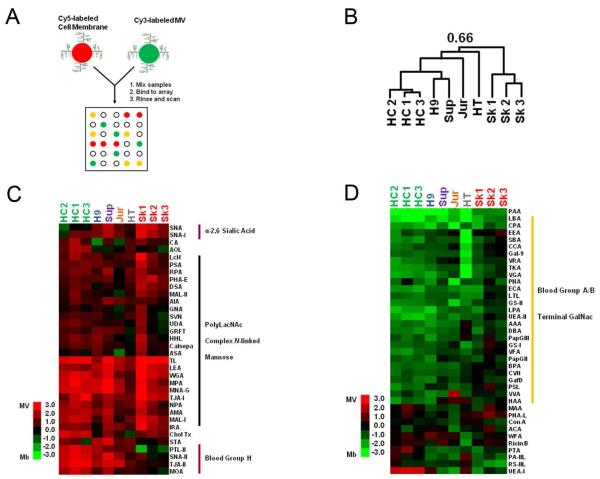
Figure 5.
Direct comparison of microvesicles with their parent cell-membranes. (A) Experimental schematic. Equal amounts of Cy3-labeled MV were analyzed against Cy5-labeled parent MB on the lectin microarray. (B) Median-centered log2 ratios were hierarchically clustered using the Pearson correlation coefficient as the distance metric and average linkage analysis (n=72 lectins). The tree is shown with the overall Pearson correlation value. Heat map shows (C) enriched and (D) lower lectin binding to glycan epitopes in MV. The entire heat map is shown in Supplementary Figure 7.

