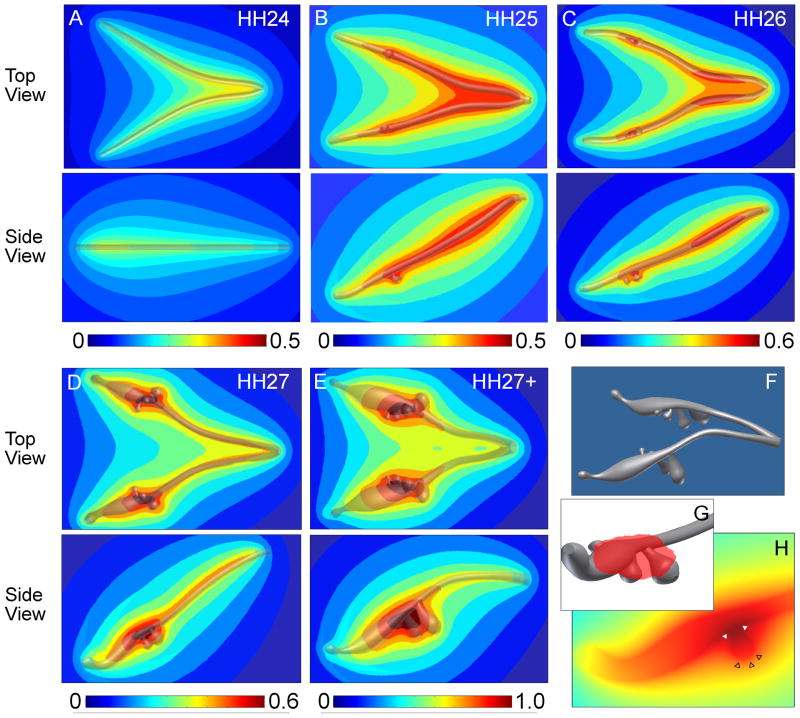
Figure 2.
Computational analysis of morphogen concentration and distribution in developing chicken lungs. (A–E) Predicted concentration profiles of a hypothetical morphogen uniformly secreted from the epithelium at various developmental stages. The concentration profiles are normalized to the highest value calculated for the HH27+ model, with red indicating areas of highest relative concentration and blue representing regions of low morphogen concentration. (F) An example solid model (HH27+) used for FEM analysis that was created from dimensions of E-cadherin-stained lung explants. (G) 3D solid model representation of the region of highest morphogen concentration represented by the red shading and (H) cross-section plot through a bud plotting morphogen concentration, which illustrates that the bud stalk and branch point have a local maximum (solid white triangles) whereas the bud tip has a local minimum (empty black triangles) in predicted morphogen concentration.

