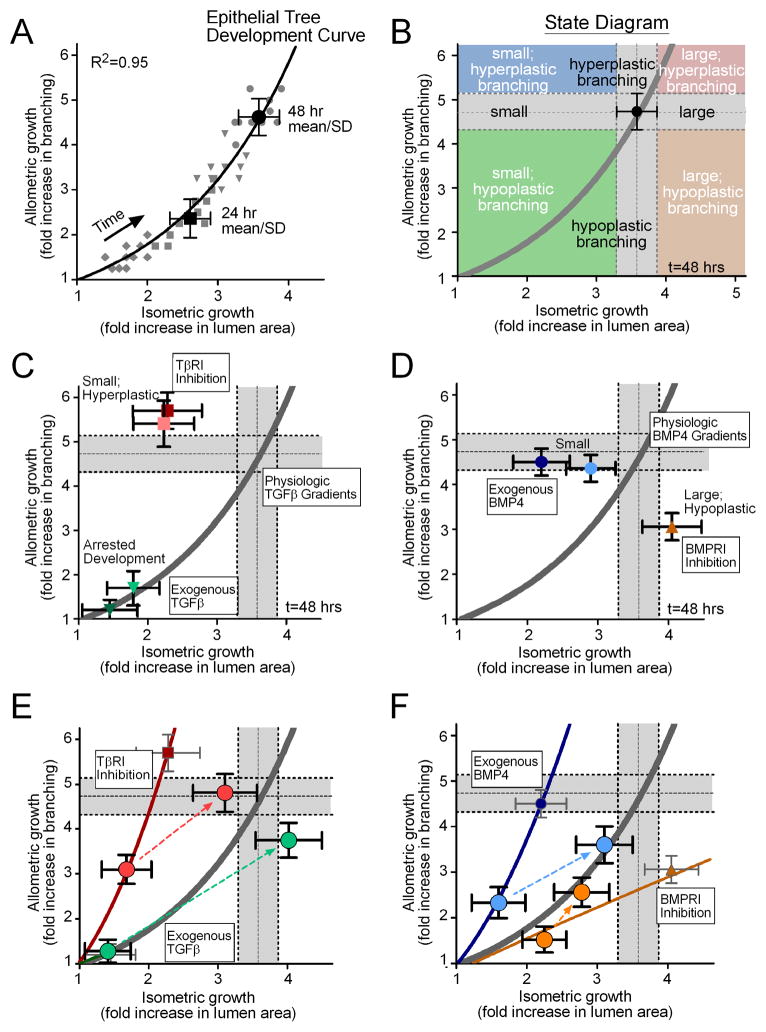
Figure 6.
Allometric analysis of lung explants. (A) Data from individual cultured lung explants at different time points (grey diamonds = 12hrs, squares = 24hrs, triangles = 36hrs, circles = 48hrs) collapse onto a single power-law curve that describes the relationship between allometric and isometric growth. The model curve (solid line) was fit to all of the individual data points (grey symbols) over all time intervals, and the 24 and 48 hour mean +/− SD are shown for reference. This model defines a master “development curve” for the epithelial tree. (B) An example “state diagram” that can be created for a given time of development, delineating parameter spaces that define small, equivalent, and large lungs, in addition to hypoplastic, equivalent, and hyperplastic branching. The grey bars indicate the 48 hour mean +/− SD and are used as a visual reference to describe control explants. Allometry plots demonstrating the effects of (C) recombinant TGFβ1 (25ng/mL = light green, 50ng/mL = dark green) and TβRI inhibitor (1.8μM = light red, 18μM = dark red), and (D) recombinant BMP4 (25ng/mL = light blue, 50ng/mL = dark blue) and BMPRI inhibitor (10μM = orange). (E,F) Allometry plots detailing the resulting morphology from washout of the reagent after 24 hrs of culture. Thin solid lines are power-law models fit to the data from explants treated for 48 hours. Large circle data points represent 24 and 48 hour mean +/− SD for treatment groups and dotted lines represent the trajectory from 24 to 48 hours following treatment washout.

