
Figure 13.
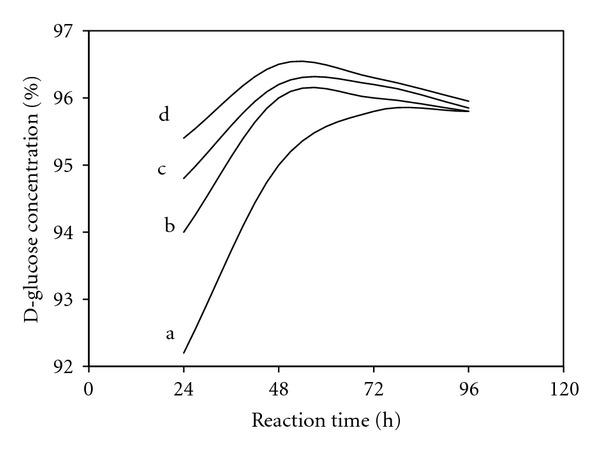
The effect of pullulanase dosage on reaction time. Symbols: a, without pullulanase addition; b, 0.04 unit of pullulanase/g dry solid; c, 0.08 unit of pullulanase/g dry solid; d, 0.16 unit of pullulanase/g dry solid (modified from [11]).
Official websites use .gov
A
.gov website belongs to an official
government organization in the United States.
Secure .gov websites use HTTPS
A lock (
) or https:// means you've safely
connected to the .gov website. Share sensitive
information only on official, secure websites.
The effect of pullulanase dosage on reaction time. Symbols: a, without pullulanase addition; b, 0.04 unit of pullulanase/g dry solid; c, 0.08 unit of pullulanase/g dry solid; d, 0.16 unit of pullulanase/g dry solid (modified from [11]).