
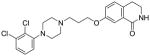
Table 5.
SFSR of combination compounds.a
| Cmpd | Structure | D2R Ki (nM) | β-arrestin | cAMP | ||
|---|---|---|---|---|---|---|
| EC50 (nM) | Emax (%) | EC50 (nM) | Emax (%) | |||
| 35 |

|
42 | 79 | 78 | N/A | < 20 |
| 36 |

|
75 | 50 | 97 | N/A | < 20 |
| 37 |

|
30 | 126 | 88 | N/A | < 20 |
| 38 |
|
20 | 63 | 71 | N/A | < 20 |
| 39 |
|
18 | 25 | 36 | N/A | < 20 |
| 40 |
|
11 | 20 | 80 | N/A | 32 |
| 41 |

|
104 | 200 | 78 | N/A | < 20 |
| 42 |
|
18 | 20 | 84 | N/A | < 20 |
| 43 |
|
5.7 | 6.3 | 41 | N/A | < 20 |
| 44 |
|
1.2 | 1.6 | 47 | N/A | < 20 |
| 45 |
|
3.4 | 2.5 | 49 | N/A | < 20 |
a
Ki, EC50, and Emax values are the average of at least 2 duplicate experiments with standard deviations (SD) values that are 3-fold less than the average.