
Figure 2.
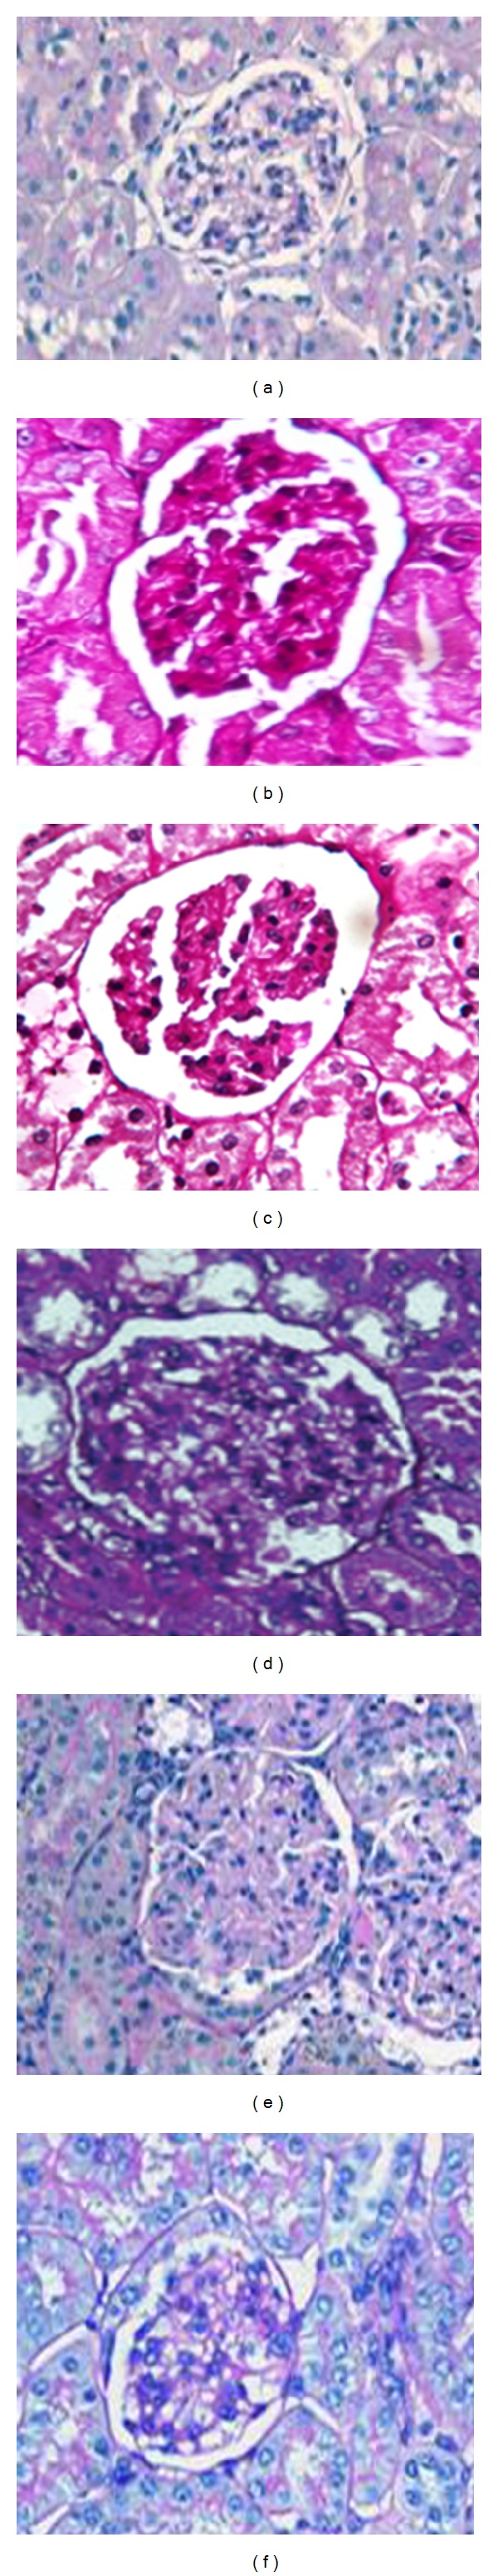
Figure (2): PAS staining of kidney sections of normal control rats (a), DN rats (b), DN treated with MF (c), FA1 (d), FA2 (e), and FA3 (f), respectively. Increased mesangial matrix, thickened CBMs, TBMs, and GBMs are present in the glomerulus of diabetic untreated rats as compared with the control and diabetic treated rats.