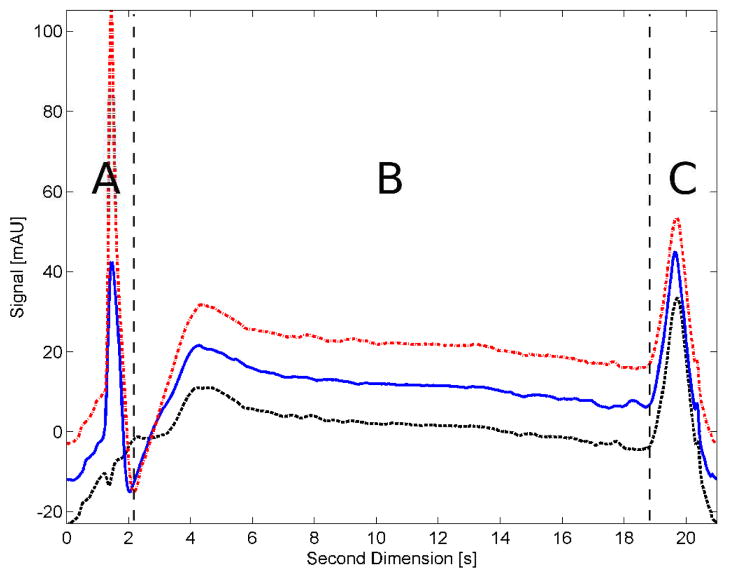
Figure 1.
Structure of the LC×LC background represented by three single 2D chromatograms of a dummy run sampled at different times of the gradient in the 1D. The amount of acetonitrile in the sample solvent transferred from the 1D to the 2D (region A) corresponds to 10 % for the black dotted curve, 30 % for the blue curve and 50 % for the red dashed curve. Region B is where most peaks elute and region C shows the system flush-out peak.

