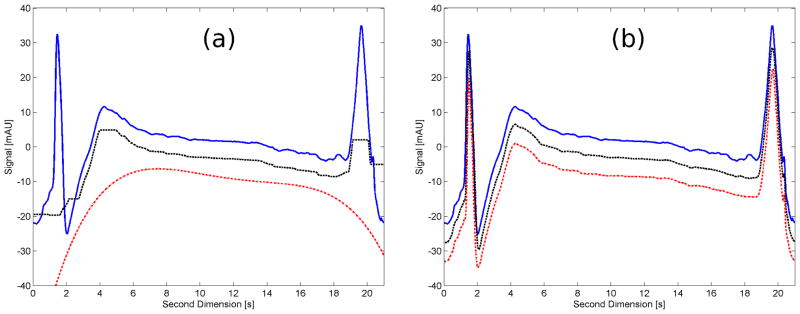
Figure 2.
Comparison of the effect of two different baseline correction methods on a typical single 2D chromatogram. The chromatograms are intentionally offset by 7 mAU to help visualization. (a) Conventional baseline correction methods: the blue solid line chromatogram is the original single 2D chromatogram; the black dashed line is the corrected baseline using a moving-median filter and the red dot-dashed line is the corrected baseline by the asymmetric polynomial fitting method. (b) The two methods are applied in combination with the OBGC method; line format same as in (a).

