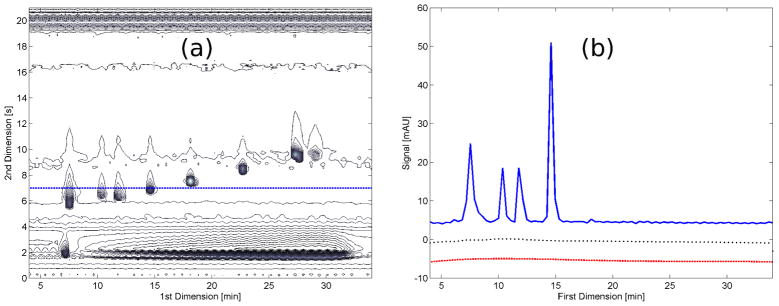
Figure 3.
(a) Contour plot of a LC×LC chromatogram of an indole standard sample, the blue dotted line shows a cut taken at 7.0 s in the 2D. (b) Blue curve: chromatogram taken as the 1D cut represented by the blue dotted line in panel (a); black dotted curve: baseline generated by the moving-median filter; red dashed curve: baseline resulting from the asymmetric polynomial fitting.

