
Figure 2.
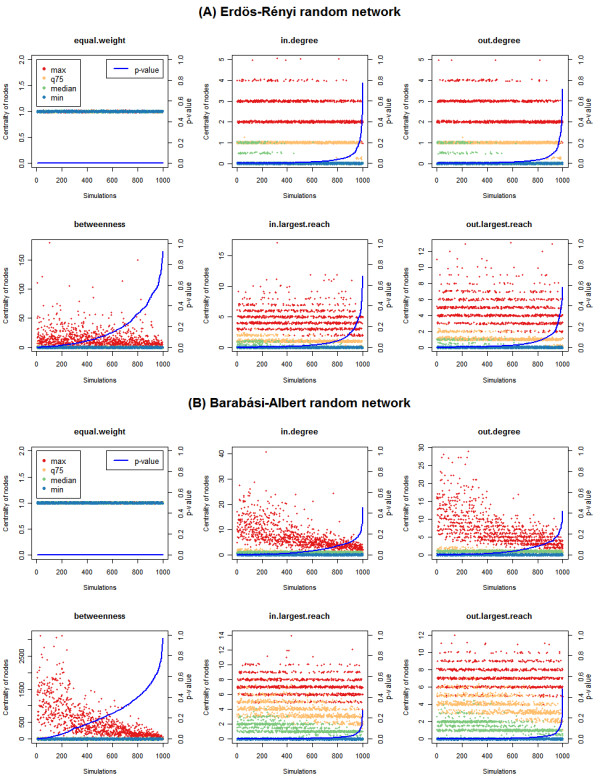
P-values and centrality distributions of pathways with different random network structures under different centrality measurements. Pathway topologies are generated from (A) Erdös-Rényi model and (B) Barabási-Albert model. Comparisons are made between in-degree, out-degree, betweenness, in-largest reach, out-largest reach centralities, as well as the equal weight condition. Each plot represents the distribution of differential nodes centralities in each simulation, assessed by maximum value, the 75th quartile, median value and minimum value. All data are ordered by p-values on the X-axis. Points in the figure are randomly shifted by small intervals for ease of visualization.