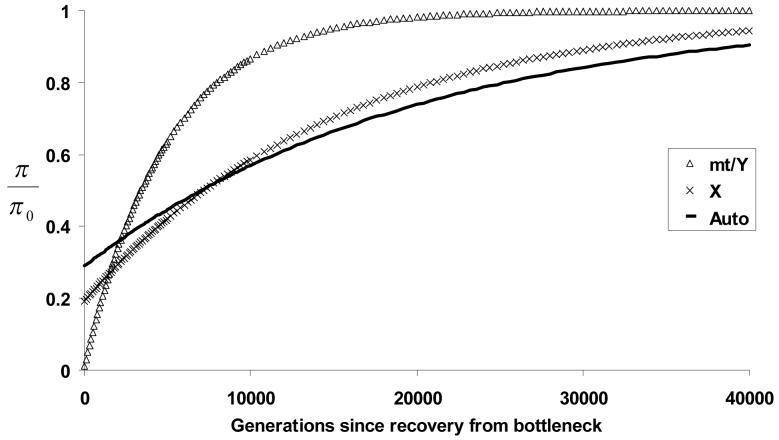
Figure 2. Recovery of variation after a population bottleneck.
Expected diversity through time following a population bottleneck (relative to pre-bottleneck levels) is shown separately for autosomal, X-linked, and uniparentally inherited chromosomes (mt/Y). In this bottleneck, a population of N = 10,000 experiences a population size reduction to f = 0.004 times this size, lasting for g2 = 100 generations until recovery to the initial size.

