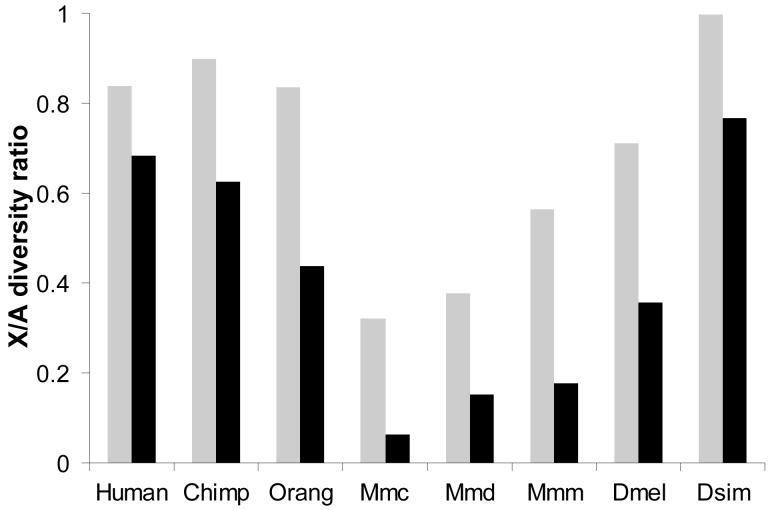
Figure 3. Reduced X/A diversity ratios in less variable populations.
Bars indicate the X/A diversity ratios of more genetically diverse (gray) and less genetically diverse (black) populations of Homo sapiens (Human), Pan Troglodytes (Chimp), Pongo pygmaeus (Orang), Mus musculus castaneus (Mmc), Mus musculus domesticus (Mmd), Mus musculus musculus (Mmm), Drosophila melanogaster (Dmel), and Drosophila simulans (Dsim). Information regarding the data can be found in the Supplemental Text.

