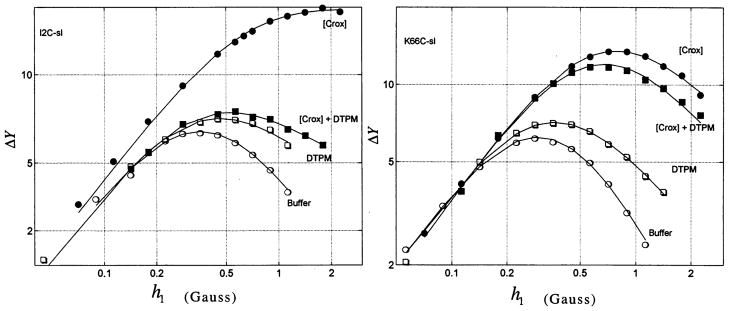
Fig. 2.
Power saturation rollover curves for I2C-Sl and K66C-sl. Curves are shown for bvPLA2 mutant in buffer with and without Crox ([Crox] and buffer) and bound to membranes with and without Crox ([Crox] + DTPM and DTPM). The fit to Eq. 1 is shown by the solid lines. The units of ΔY are arbitrary.

