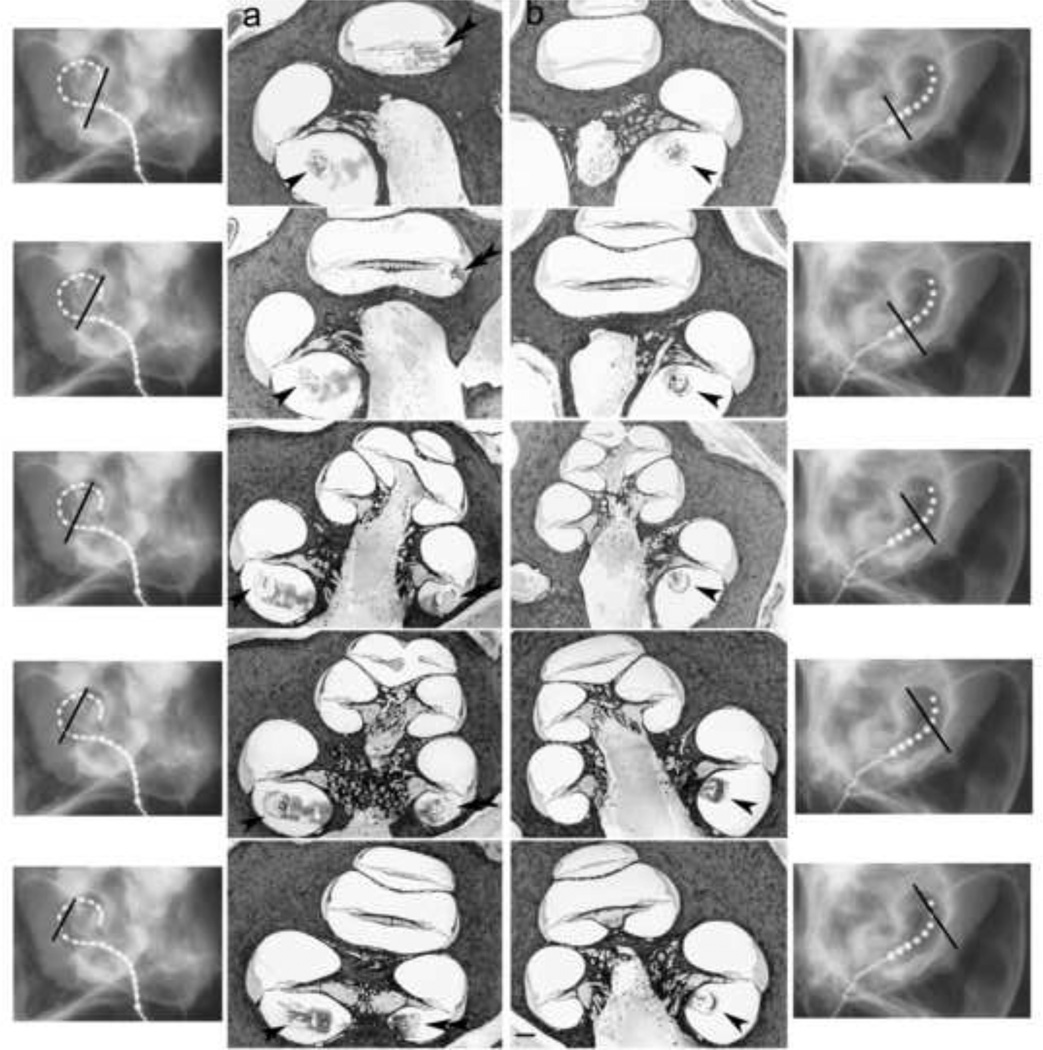
Figure 5.
Serial micrographs from a left cochlea implanted with a Hybrid-L24 array (a) and a right cochlea implanted with a standard array (b). The location of the electrode array in the lower basal turn is illustrated by a single arrowhead while a double arrowhead illustrates an array in the upper basal turn. The approximate histological plane for each image is illustrated by the solid line in the accompanying radiographs. Scale bar = 500 µm.

