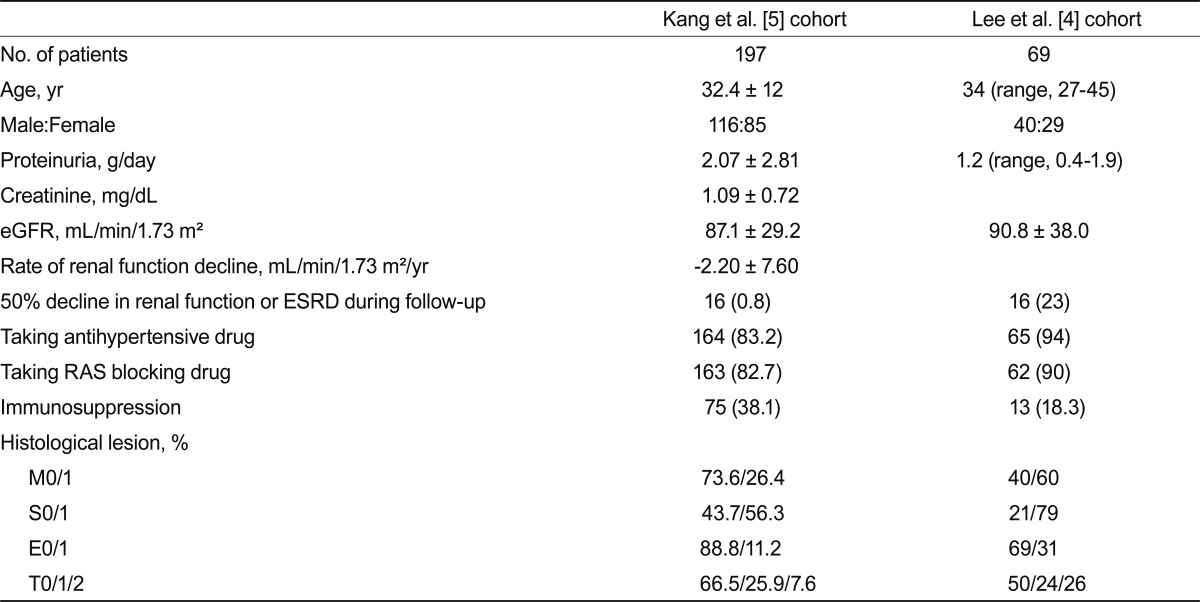
Table 1.
Comparison of the Lee and Kang cohorts
Values are presented as number (%) or mean ± SD.
eGFR, estimated glomerular filtration rate; ESRD, end stage renal disease; RAS, rennin-angiotensin system; M, mesangial hypercellularity; S, segmental glomerulosclerosis; E, endocapillary hypercellularity; T, tubular atrophy/interstitial fibrosis.

