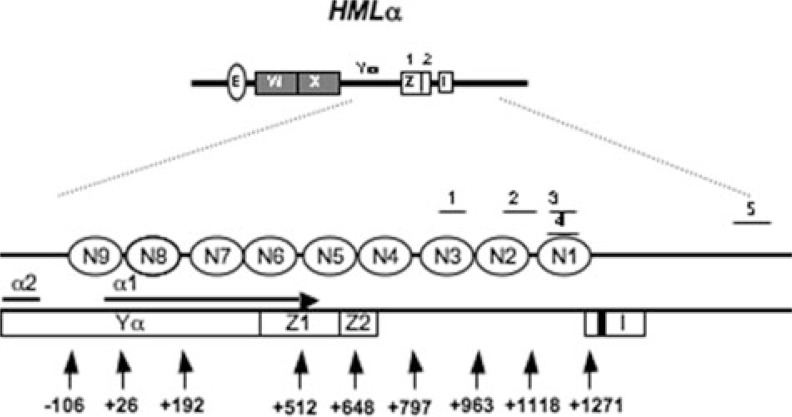
FIGURE 1.
Schematic representation of the physical map of HMLα locus (adapted from Weiss and Simpson (25)). The I silencer is indicated by a white box labeled “I.” The ABF1 binding sequence is shown by a black bar; open ellipses indicate positioned nucleosomes (N1–N9). The α1 coding region is identified by the horizontal arrow. The numbered vertical arrows mark the relative nucleotide positions from the α1 ATG start codon; A is +1. qPCR regions (1–5) are as follows: qPCR1, +871 to +959; qPCR2, +1056 to +1156; qPCR3, +1163 to +1248; qPCR4, +1162 to +1278; qPCR5, +1884 to +2095.

