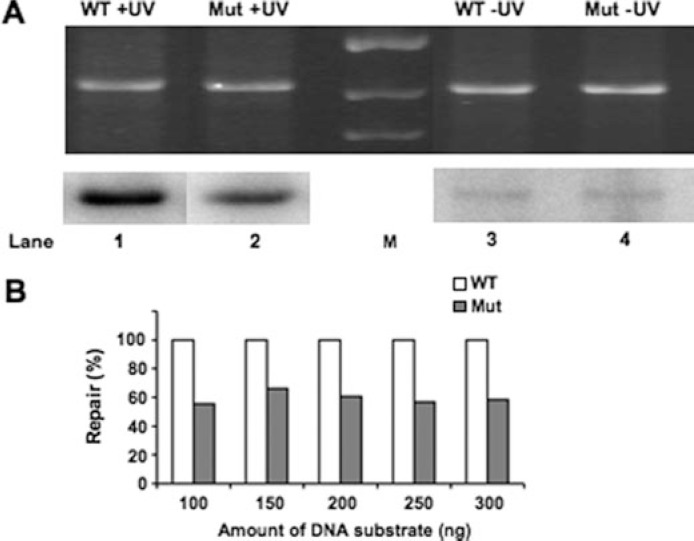
FIGURE 3.
In vitro NER analysis to monitor repair synthesis. NER was performed at 26 °C for 2 h using UV radiation-damaged (+UV; 300 J/m2) or undamaged (−UV) plasmid pUC18-ABF1-HIS3 (WT; lanes 1 and 3, respectively) or pUC18-ABF1bs-HIS3 (Mut; lanes 2 and 4, respectively) in the presence of wild-type yeast whole cell extract. A, ethidium bromide-stained gel represents the total DNA loading (top), and an autoradiograph of the gel indicates the level of DNA repair synthesis or background radiolabel incorporation for the damaged (+UV) or undamaged (−UV) plasmids (bottom). M, DNA marker lane. B, relative levels of DNA repair radiolabel incorporation for the damaged (+UV) or undamaged (−UV) plasmids at the range of DNA substrate amounts indicated.

